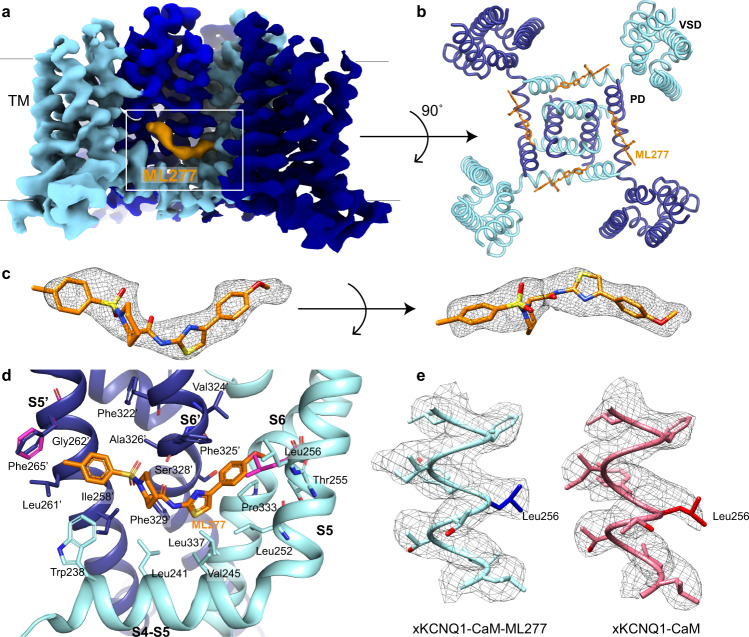
Fig. 2. ML277 binding to xKCNQ1-CaM.
a The cryo-EM density map for xKCNQ1-CaM-ML277 with the density for ML277 indicated in orange. The density map is cut off at the TM region for clarity. b Top view of xKCNQ1-CaM-ML277 from the extracellular side is shown with ML277 (orange) bound in its hydrophobic pocket. The structure is clipped in the frontal plane at the level of the binding site for clarity. c Isolated density (5x rmsd) for ML277 is shown as a mesh with the ML277 docked inside in the orientation with the highest map-to-model correlation coefficient. d Enlarged side view of the ML277 binding pocket formed by the S4-S5 linker helix, the transmembrane spanning S5 and S6 helices from one protomer (light blue) and the S5′ and S6′ from an adjacent protomer (dark blue). The position of the side chain of Leu256 and the possible rotation of the phenyl ring of Phe265′ in the xKCNQ1-CaM structure are shown in pink. e Comparison of the density map (contour level at 5x rmsd) for xKCNQ1-CaM and xKCNQ1-CaM-ML277 focused on the S5 helix.

