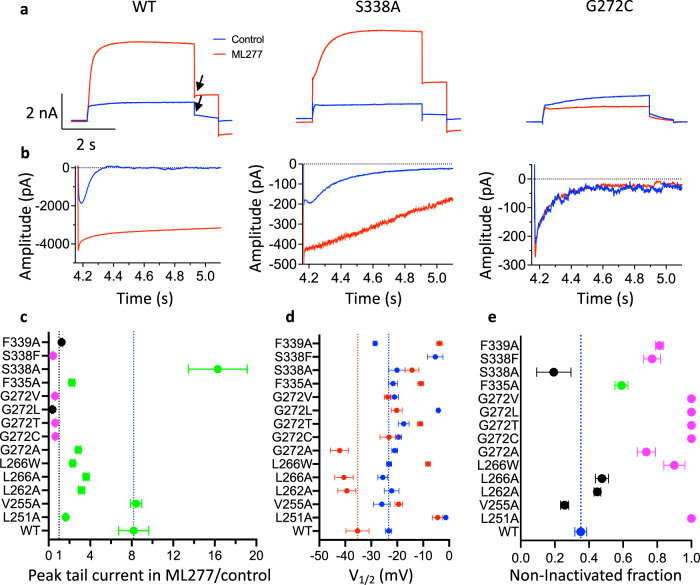
Fig. 7. Mutations to ML277 binding site residues reduce or eliminate drug effects on hKCNQ1.
a Current traces in control (blue) and after addition of 1 μM ML277 (red) for WT and mutant channels. Cells were held at −90 mV, pulsed to +60 mV for 4 s, then −40 mV for 0.9 s. The interpulse interval was 15 s. Arrows show peak tail measurements for graph in panel c. b Tail currents at −120 mV after 4 s pulses to +60 mV in control (blue) and in ML277 for different mutants as indicated in a. Note: residue numbering in hKCNQ1 is +10 compared with xKCNQ1. c KCNQ1 tail current amplitudes in ML277 divided by initial control tail, protocol as in panel a. Error bars denote mean ± SEM, n = 3–8 cells, (see Supplementary Table 2 for exact n values). Black indicates no drug effect; magenta indicates a significant decrease, and green indicates a significant increase from control (see Supplementary Table 2). Only V255A is not significantly different from WT, otherwise P = 0.008–>0.001 using one-way ANOVA. d Mean V1/2 of activation before (blue) and after (red) exposure to 1 μM ML277. Protocol as in panel a. See Supplementary Table 3 for n and mean values and significance tests. For S338F, tail currents in ML277 were too small to measure. e Initial tail current amplitude in control divided by extrapolated fit to tail current decay, as a measure of channels that are not inactivated at the start of the tail, values represent the mean ± SEM. WT is blue, not significantly different from WT is black, significantly less inactivated than WT, P < 0.05 (green) and P < 0.01 (magenta). Where no hook was observed, a value of 1 is given for non-inactivated fraction, e.g., L251A and G272C (b). Note that in some cases error bars fall within plotted symbols. n = 4 cells for L262A, L266A and F335A, n = 5 cells for L266W, G272V and S338F, for all others n = 3 cells. Source data are provided as a Source Data file for panels c–e.

