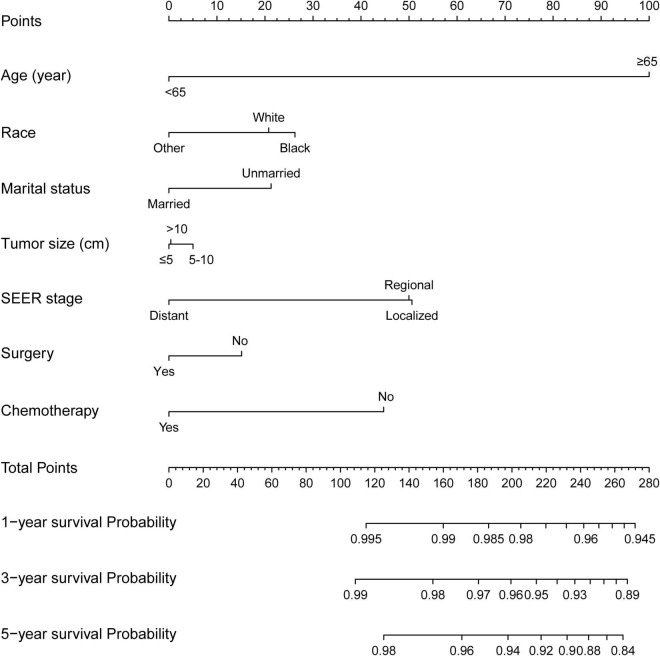
FIGURE 3.
Competing-risk model for predicting the 1-, 3-, and 5-year probabilities of CVD among patients with CRC. The “total points” of a certain patient was calculated by adding all the scores of the 7 parameters. Based on the total points, the possibilities of CVD at different timepoints and the prognostic group was obtained.

