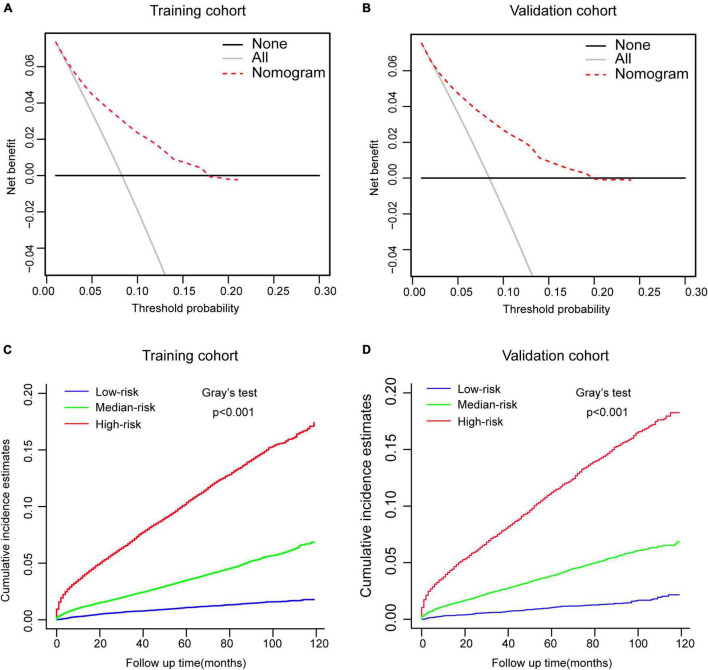
FIGURE 5.
Performance and risk stratification of the competing-risk model. (A,B) Decision curves of the nomogram predicting CVD in the training and validation cohort, respectively. (C,D) Cumulative incidence function (CIF) curves with the p-value of Gray’s test for the training and validation cohort, respectively.

