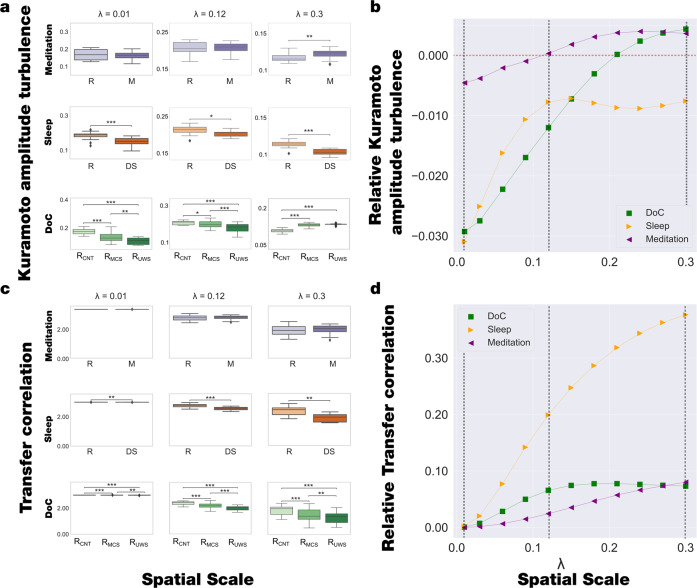
Fig. 2. Model-free framework reveals significant differences in Kuramoto amplitude turbulence and transfer correlation in different brain states.
a The plots show the level of Kuramoto amplitude turbulence at different spatial scales, from λ = 0.01 (100 mm) to λ = 0. 3 (3 mm) in steps of 0.03, and show the comparison between brain states for λ = 0.01, λ = 0.12 and λ = 0.3. The meditation state showed significant increases in Kuramoto amplitude turbulence compared to the resting state only on higher scales. The DS shows significantly lower Kuramoto amplitude turbulence than the resting state across all spatial scales. By contrast, the Kuramoto amplitude turbulence showed significant decreases in RMCS and RUWS states in lower lambda scales but significant increases in higher scales compared to RCNT. b The plots were computed as the linear fit of the mean level of Kuramoto amplitude turbulence at each scale for the three brain states for the DOC dataset (i.e., RCNT, RMCS, and RUWS) and two brain states for sleep and meditation datasets (i.e., W, DS, and R, M, respectively). The plots display the obtained slopes as a function of the scale. In particular, DOC showed negative slopes at lower scales and increased with the scales up to positive slopes. The sleep dataset presented negative slopes at lower scales, increased up to λ = 0.12, and a negative slope value was kept almost constant. The meditation dataset also increased with scale but presented less variability than the other datasets. Dashed vertical lines indicate the scales displayed in A and the horizontal red dashed line highlights the zero slope. c We computed the transfer correlation (|Aλ|), which measures how the information travels across space at different spatial scales, i.e., we show the results as a constant k - |Aλ|, with k = 3 |Aλ|. The meditation state presents no significant differences on any scale compared to the resting state. In contrast, the transfer correlation significantly decreased for DS and RMCS, RUWS states compared to the resting state across all scales. d We performed the same computation as in panel B for the transfer correlation measure. In this case, DOC and sleep datasets presented a similar slope-scale relationship, whereas the meditation dataset presented less variability across scales. In the figure, P-values were assessed using the Wilcoxon rank-sum test and corrected for multiple comparisons, *P < 0.05, **P < 0.01 and ***P < 0.001.

