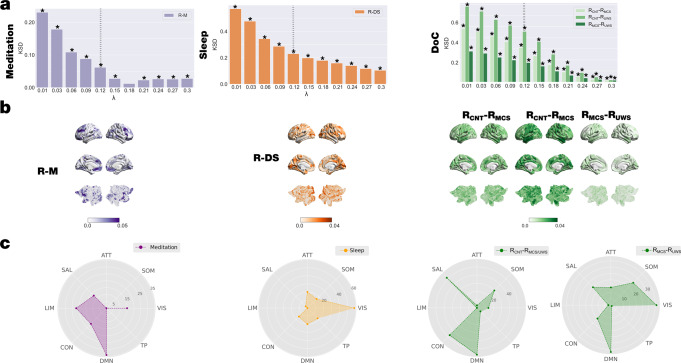
Fig. 4. Local node-level metastability was significantly different between brain states and revealed distinct signatures of network involvement.
We computed the node-level metastability as the standard deviation across time of the local Kuramoto order parameter (see Methods). a We performed the KSD between distributions of the node-level of metastability of each brain state within each dataset for each scale. The KSD for all datasets monotonically decreases, whereas the value of λ increases for all comparisons. b Render brains represent the absolute difference of the node-level metastability between each brain state for scale λ = 0.12, indicated with vertical dashed lines in panel A. We selected the top 15% quantile of absolute differences between conditions, identified the resting state networks to which they belong and quantified the number of nodes per network. c Radar plots represent the number of nodes on the top 15% quantile of the absolute difference by each comparison and resting-state network (CON: control; DMN: default mode; TP: temporal-parietal; VIS; visual; SOM: somatomotor; ATT: attentional; SAL: salience; LIM: limbic). The networks showing the highest differences between resting and meditation states were the limbic and default-mode networks. The comparison between deep sleep and resting state shows that nodes of the visual- and default-mode- networks present the highest difference. Finally, the comparison between RCNT and DOC patients (RMCS and RUWS) shows that the somatomotor-, salience-, control-, and default-mode- networks present the highest differences, whereas, specifically in the comparison between RMCS and RUWS nodes associated with the somatomotor- and control- networks present the highest differences. P-values were assessed using the Kolmogorov–Smirnov test and corrected for multiple comparisons, *P < 0.001.

