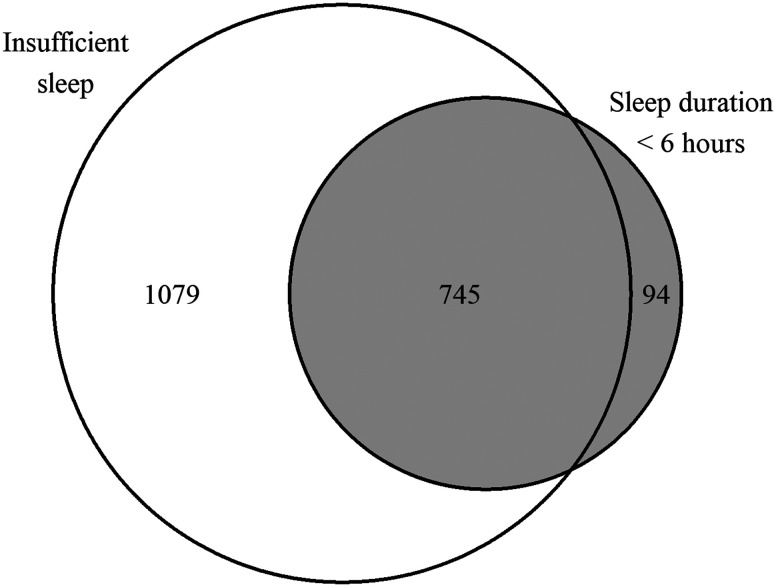
Figure 1. Venn diagram of participants with insufficient sleep and sleep duration below 6 hours at baseline.
Participants in the gray area were defined as having short sleep, while participants in the white area were defined as having insufficient sleep (defined as a sleep sufficiency index of < 0.8).

