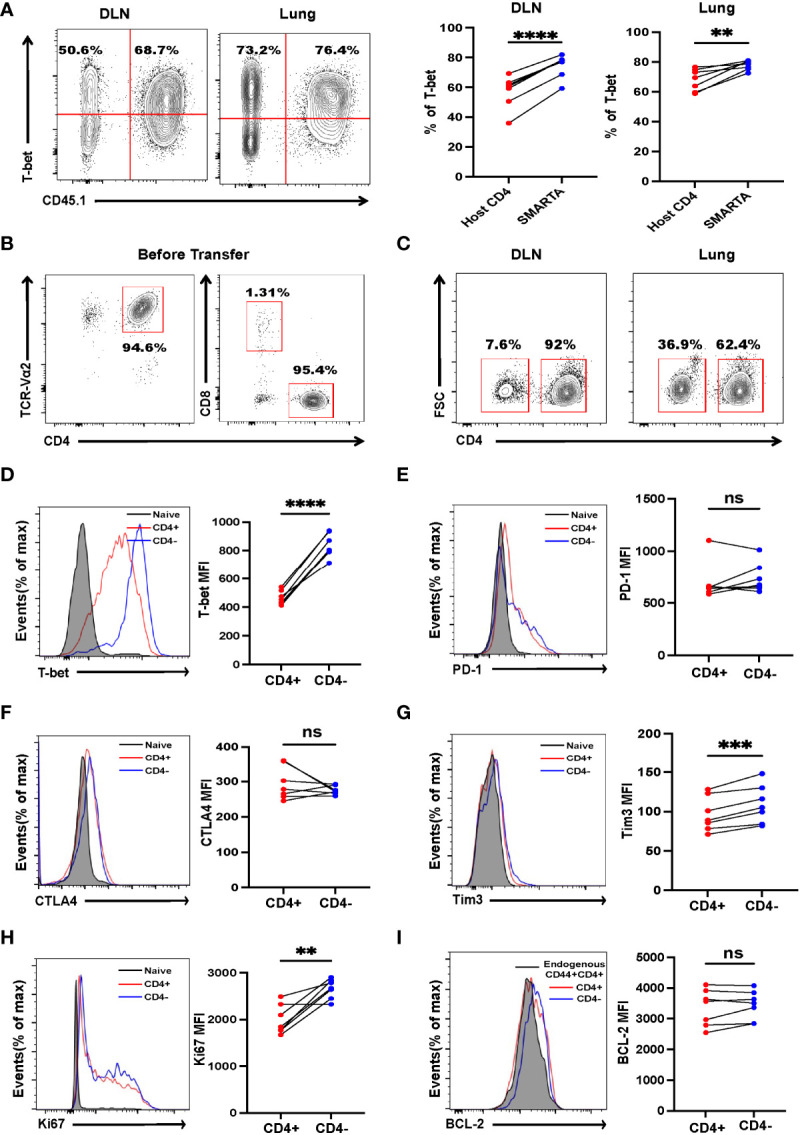
Figure 2.

Tumor-specific CD4+ T cells differentiate into Th1 and CD4- T cells. B16-GP tumor-bearing C57BL/6J mice were adoptively transferred with 2 × 10⁶ activated SMARTA cells on Day 8 after tumor inoculation and sacrificed seven days later. (A) Left panel: representative flow cytometry plots of T-bet expression in CD4+ T cells in draining lymph node (DLN) and lung tissue (Lung). Cells are gated on live CD44+CD4+ T cells. The numbers are percentages of cells accounting for CD45.1-(left quadrant) and CD45.1+ (right quadrant) populations. Right panel: the statistical analysis of percentages of T-bet positive cells as shown in the left panel (n=7/group). (B) The purity of the activated SMARTA cell before transfer. (C) Representative flow cytometry plots of CD4+ and CD4– SMARTA cells in the DLN and lung and cells are gated on live CD45.1+ cells. Numbers are frequencies of indicated populations (n=7/group). (D-I) Flow cytometry analyses of SMARTA cells isolated from the lung comparing the expression level of T-bet, PD-1, CTLA4, Tim3, Ki67 and BCL-2 between CD4+ and CD4- SMARTA cells. The mean fluorescent intensities (MFIs) are summarized beside. Cells are gated on live CD45.1+ cells (n=7/group). Statistical differences are calculated by paired student’s t test. ns, not significant, **p <0.01, ***p < 0.001, ****p < 0.0001.
