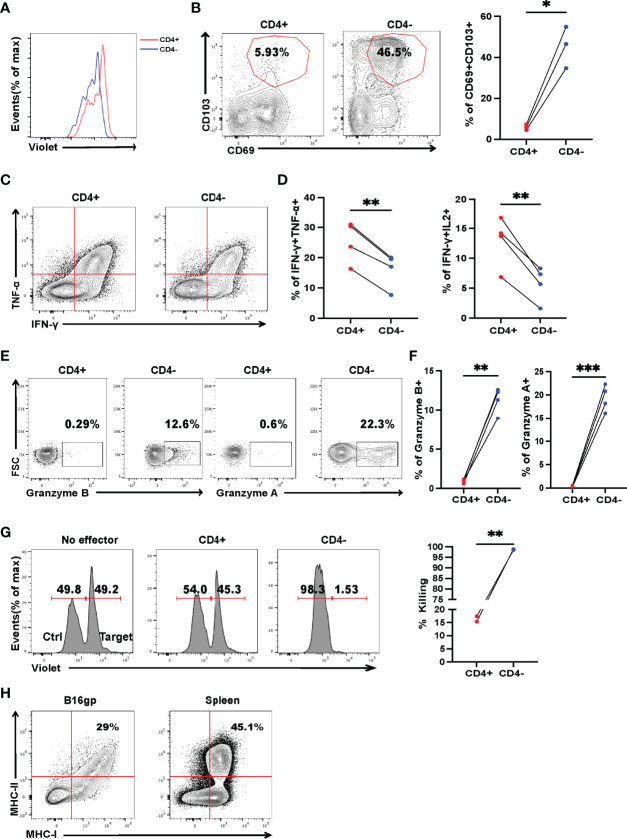
Figure 3.
Cytotoxic CD4– T cells, differentiated from CD4+ T cells, are critical for controlling established tumor metastasis. Tumor-bearing mice were treated with 2 × 10⁶ activated SMARTA cells eight days after tumor inoculation and sacrificed on Day 7 or Day 15 post-transfer. (A) Flow cytometry analysis of the dilution pattern of the cell proliferation dye on CD4+ and CD4– SMARTA cells which were sorted from the metastatic lung tissue on Day 7 post cell transfer and labeled with CellTrace Violet, followed by in vitro stimulation of plate-bound anti-CD3(1ug/ml) and soluble anti-CD28(1ug/ml) for 72 h Cells are gated on live CD45.1+ cells. (B) Representative flow cytometry plots of CD69 and CD103 expression in CD4+ and CD4– SMARTA cells on Day 15 post cell transfer. The frequencies of CD69+CD103+ cells in each population are summarized beside. (n=3/group). (C, D) Representative FACS data of TNF-α and IFN-γ production of CD4+ and CD4– SMARTA cells after in vitro GP66-77 re-stimulation on Day 7 post-SMARTA transfer. Frequencies of IFN-γ+ TNF-α+ and IFN-γ+ IL-2+ cells in the indicated populations are summarized in (D). (n=4/group). (E, F) Representative FACS data of Granzyme A and Granzyme B production of CD4+ and CD4– SMARTA cells after GP66–77 re-stimulation on Day 15 post cell transfer. Frequencies of Granzyme B+ and Granzyme A+ cells in the indicated populations are summarized in (F). (n=4/group). (G) Flow cytometry analyzing the killing capacity of CD4+ and CD4– SMARTA cells, in which Violet-high B220+ cells loaded with MHC class II-restricted peptide GP66–77 (recognized by SMARTA cells) were target cells, whereas Violet-low cells labeled with GP33–41 as control; the effector: target ratio is 10:1. The percentage of killing by the populations is summarized beside. (H) Flow cytometry plots of MHC-I and MHC-II expression in B16-GP cells harvested from metastatic lung or in splenocytes of C57BL/6J mouse (positive control). Statistical differences are calculated by paired student’s t test. *p <0.05, **p <0.01, ***p < 0.001.

