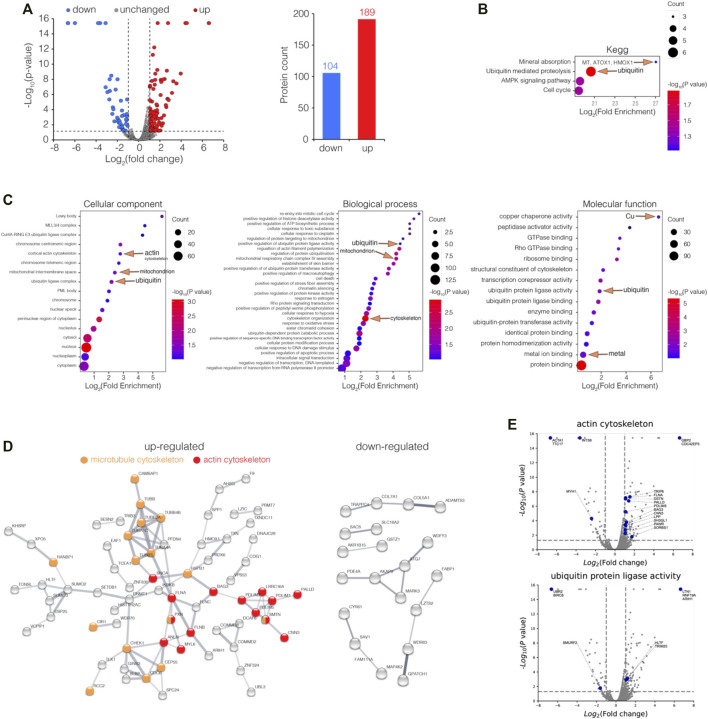
FIGURE 2.
Enrichment analysis of differentially expressed proteins (DEPs) in GSH-depleted HK-2 cells upon bismuth treatment. (A) Volcano plot visualizations of DEPs (fold of change >2 or <0.5, p value <0.05) in GSH-depleted HK-2 cells treated with 500 μM CBS for 24 h, and 189 and 104 proteins were up and downregulated among 6,230 proteins, respectively. (B) Enrichment analysis of DEPs in GSH-depleted HK-2 cells treated with CBS, in perspective of KEGG, and (C) GO cellular component, molecular function, and biological process. (D) Protein–protein interaction networks of both up and downregulated DEPs generated using STRING. (E) Volcano plots visualizing DEPs involved in GO terms: actin cytoskeleton and ubiquitin protein ligase activity. The cells were treated with 500 μM L-BSO for 24 h to remove GSH before CBS treatment. CBS induces MT expression only in the absence of GSH.

