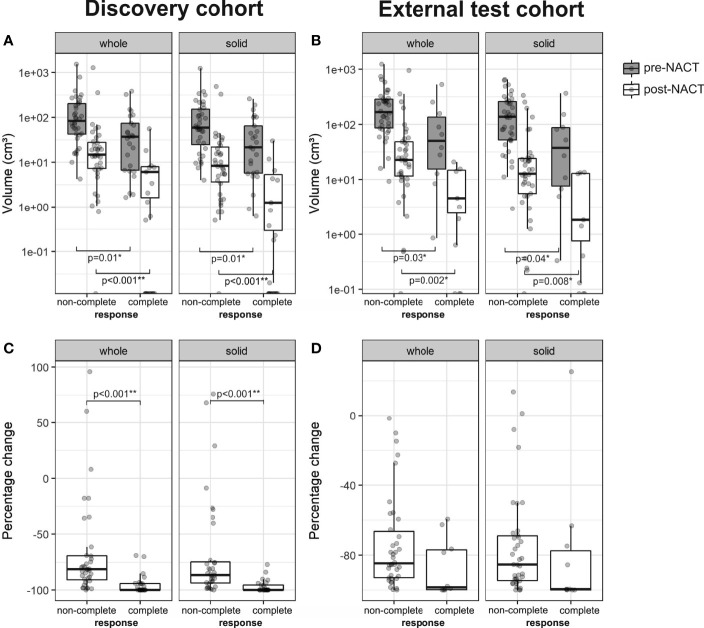
Figure 3.
Boxplots of the whole tumor and solid tumor volume in patients with non-complete (CRS1-2) and complete response (CRS3) from the (A) discovery (n = 61, non-complete response = 36, complete response = 25) and (B) external test cohorts (n = 48, non-complete response = 38, complete response = 10). Percentage change of whole tumor and solid tumor volume is shown in (C) for the discovery cohort and in (D) for the external test cohort. For pre- and post-NACT volumes, a logarithmic scale was used on the y-axis.

