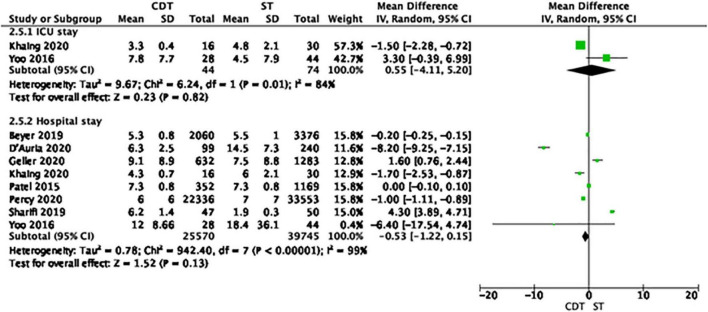
FIGURE 2.
Forest plot of length of hospital stay in the catheter-directed therapies (CDT) group and systemic thrombolysis (ST). Each green rectangle or square represents an individual study, with 95% confidence intervals of the result displayed as black horizontal lines. The diamonds show the result when all the individual studies are combined together and averaged.

