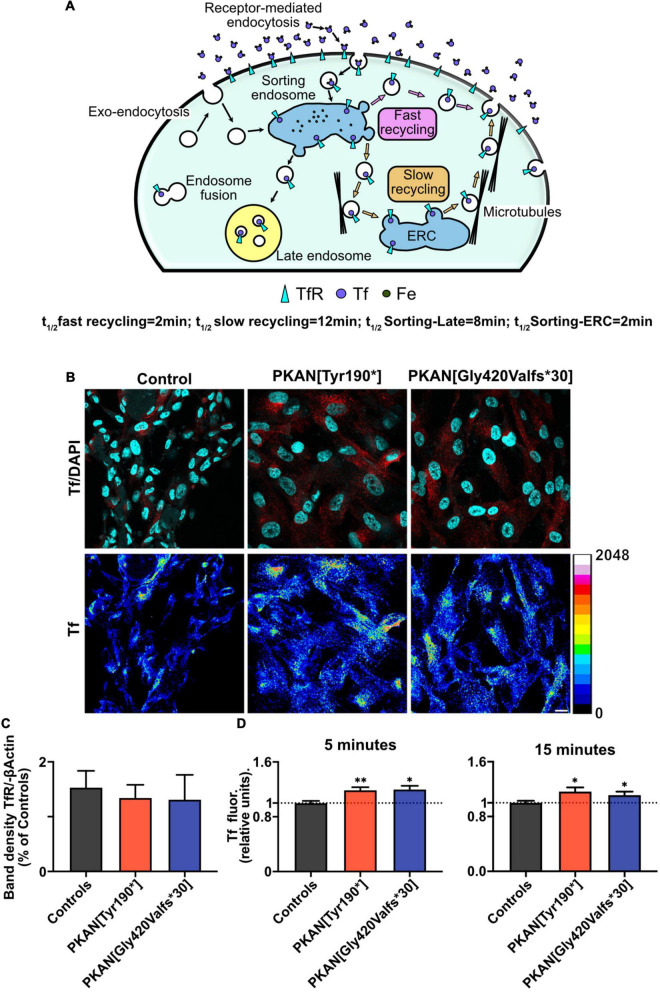
FIGURE 1.
PKAN astrocytes show an increased Tf uptake. (A) Schematic cartoon depicting the structure and functioning of the main endosomal compartments fate and vesicular tagging by Tf. (B) Confocal images of astrocytes, and their live uptake of fluorescent transferrin applied for 15 min (Tf red in upper panels, and 16 colors LUT, as indicated alongside, in lower panels), in controls and two different PKAN patients [PKAN(TYR190*); PKAN[Gly420Valfs*30)] (scale bar 20 μm). (C) Quantification of Western blot analyses for TfR1 (ns, One-Way ANOVA, n = 3 independent replicates). (D) Histograms show the mean cellular Tf uptake in astrocytes from control and PKAN patients at different pulse and chase time (Mann–Whitney test, n ≥ 95 cells analyzed for each, from at least three independent replicates). Error bars are SEM for all. *p < 0.05; **p < 0.01; ***p < 0.001; ****p < 0.0001 for all.

