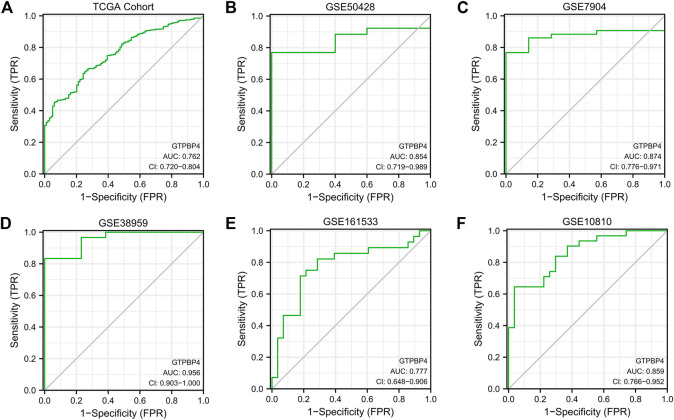
FIGURE 4.
The diagnostic accuracy of GTPBP4 was quantified by constructing a ROC curve and calculating the area under the curve. (A) ROC curve of TCGA cohort. The AUC value is 0.762. (B) ROC curve of GSE50428. The AUC value is 0.854. (C) ROC curve of GSE7904. The AUC value is 0.874. (D) ROC curve of GSE38959. The AUC value is 0.956. (E) ROC curve of GSE161533. The AUC value is 0.777. (F) ROC curve of GSE10810. The AUC value is 0.859.

