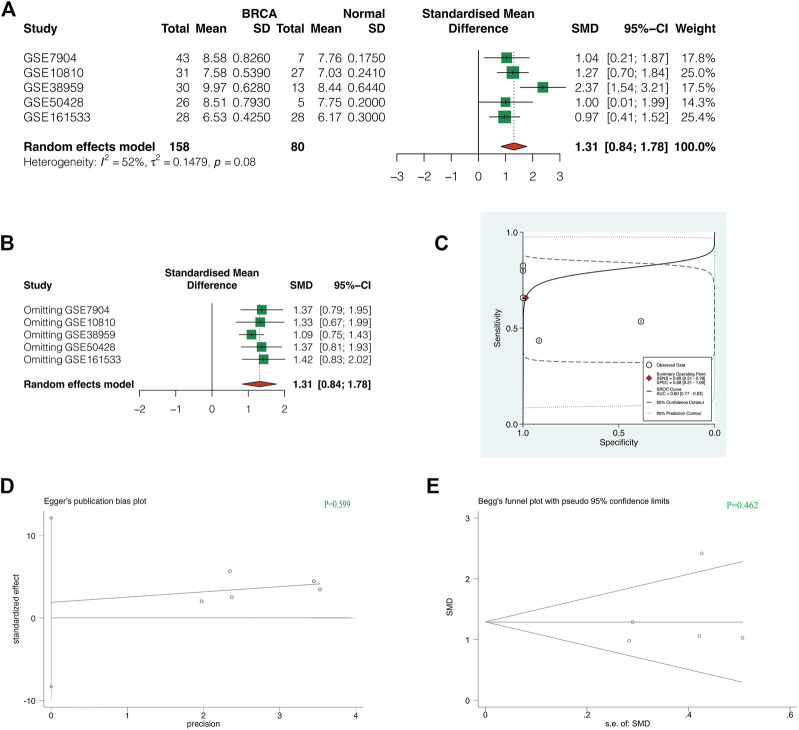
FIGURE 5.
Comprehensive analysis of GTPBP4 in multiple GEO datasets. (A) The random effect model was used for analysis due to heterogeneity I2>50%. The combined SMD was 1.31, 95%CI was [0.84, 1.78]. (B) Sensitivity analysis showed that the results of our meta-analysis were reliable. (C) The AUC value of sROC curve was 0.80, indicating good diagnostic accuracy of GTPBP4 (D,E) The p-value of Egger test was 0.599, and the p-value of Begg test was 0.462, indicating that there was no obvious publication bias.

