FIGURE 7.
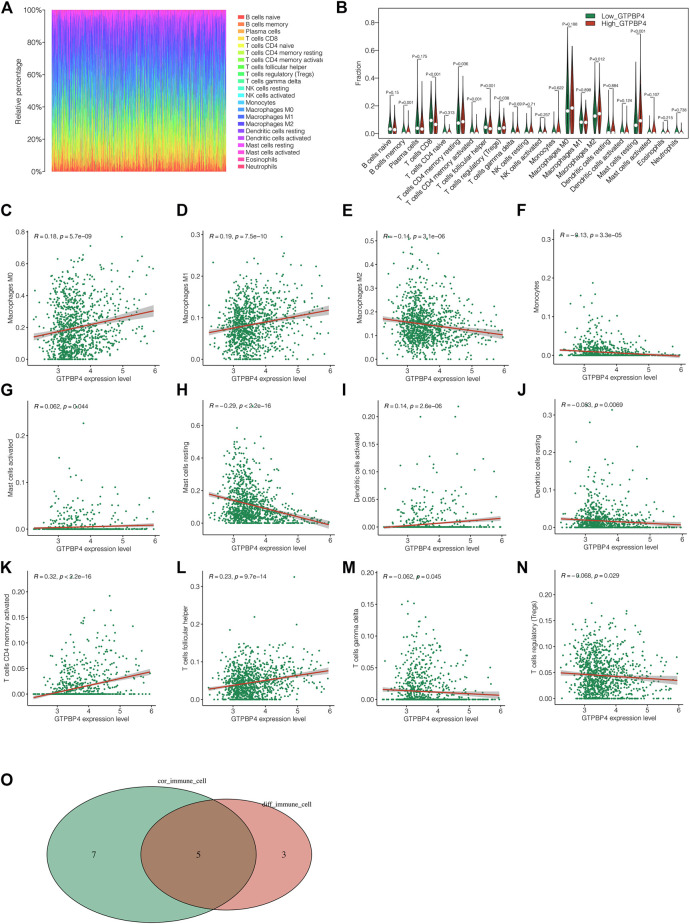
Analysis of immune microenvironment. (A) Immune landscape of breast cancer. We can see the proportion of different immune cell types. (B) The differences in immune cell infiltration levels between the high GTPBP4 expression group and the low GTPBP4 expression group, and 8 different immune cells were obtained (C–N) Correlation analysis showed that 12 kinds of immune cells were significantly correlated with GTPBP4 (O) Five most significant immune cell types were obtained by intersection of 8 different immune cell types and 12 related immune cell types.

