Figure 7.
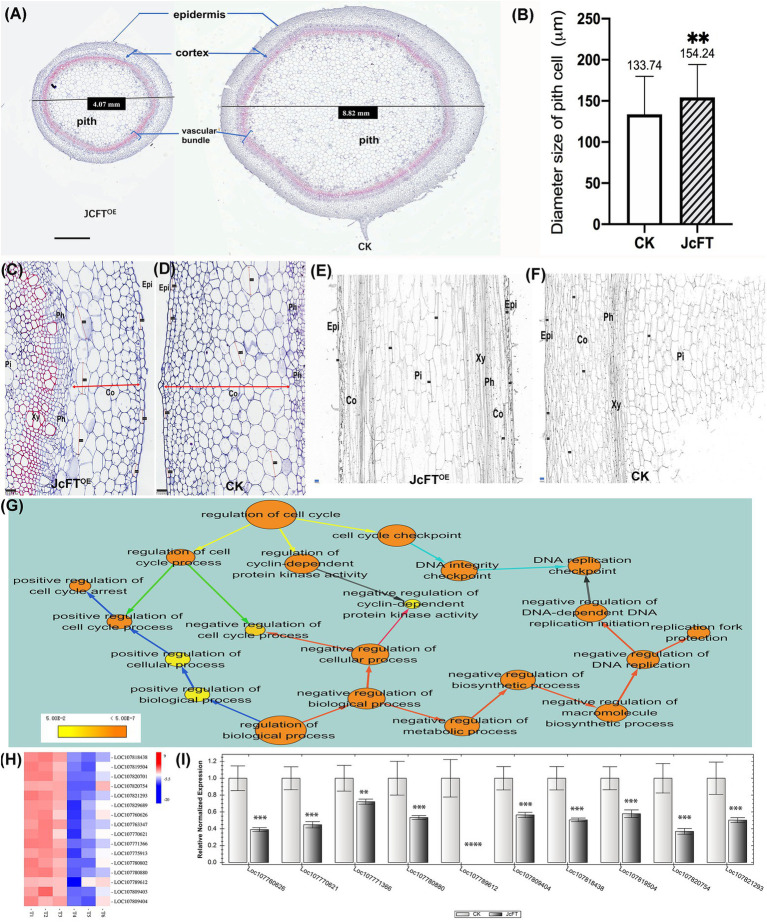
Comparison of stem cell morphology, number, and size and cell cycle regulation between JcFTOE and control (CK) plants. (A) Stem cross sections of JcFTOE and control plants (The values in the central boxes represented the diameter size of the samples, scale bar = 1 mm). (B) Average size of pith cells in JcFTOE and control plants (The values represented mean, the vertical bars indicated standard deviation, n = 66, **p < 0.01). (C,D) Stem cross sections (same magnification) of JcFTOE and control plants at 49 days after seeding (scale bar = 100 μm). Double arrows indicate thickness of the cortex, and straight lines indicate larger cells in the cortex. (E,F) Stem longitudinal sections (same magnification) of JcFTOE and control plants at 49 days after seeding (scale bar = 100 μm). (G) BiNGO annotated overrepresented GO (gene ontology) terms associated with cell cycle regulation. Color of a node represents the corrected p-value, with the scale ranging from yellow (p = 0.01) to dark orange (p = 0.01 × 10⁻⁵) and size of a node indicates the number of genes involved. Different colors of arrows suggested different types of enriched pathways. (H) Expression heat map of differentially expressed genes (DEGs) associated with DNA-dependent DNA replication initiation. Control samples: T1, T2, T3; JcFTOE samples: T4, T5, T6. Blue indicates a decrease in gene expression; red indicates an increase in gene expression. (I) Reverse-transcription qPCR of 10 DEGs associated with DNA-dependent DNA replication initiation (bars represented gene expression mean and standard error of mean, n = 3, **p < 0.01, ***p < 0.001, ****p < 0.0001, and the corresponding gene accession number was under the bars.). Epi: epidermis; Co: cortex; Ph: phloem; Xy: xylem; Pi: pith.

