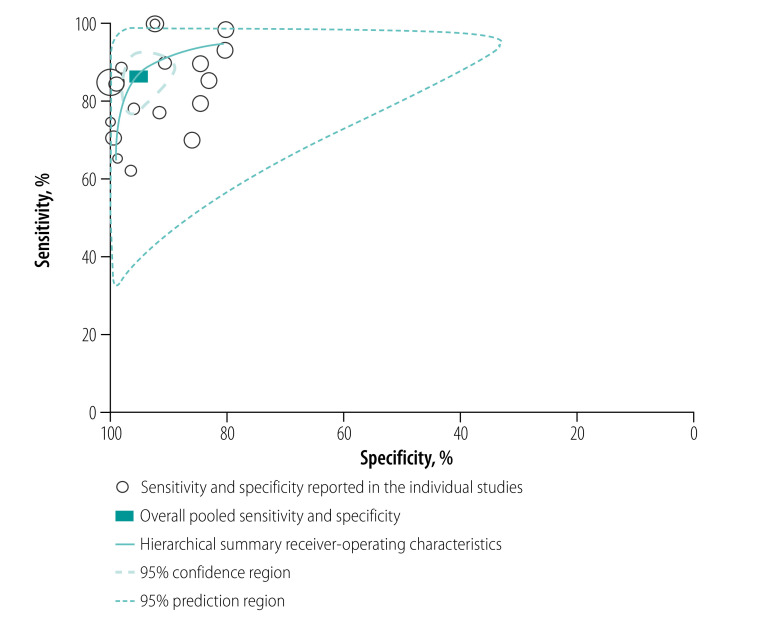
Fig. 3.
Hierarchical summary receiver-operating characteristic curves of the sensitivity and specificity of Ebola virus rapid diagnostic tests compared with RT–PCR
RT–PCR: reverse transcription polymerase chain reaction.
Notes: Each open circle represents the sensitivity and specificity of each included data point (n = 19). The size of each circle is proportional to the sample size of the study. A curve close to the upper left-hand corner of the hierarchical summary receiver-operating characteristic curve indicates better overall performance.35

