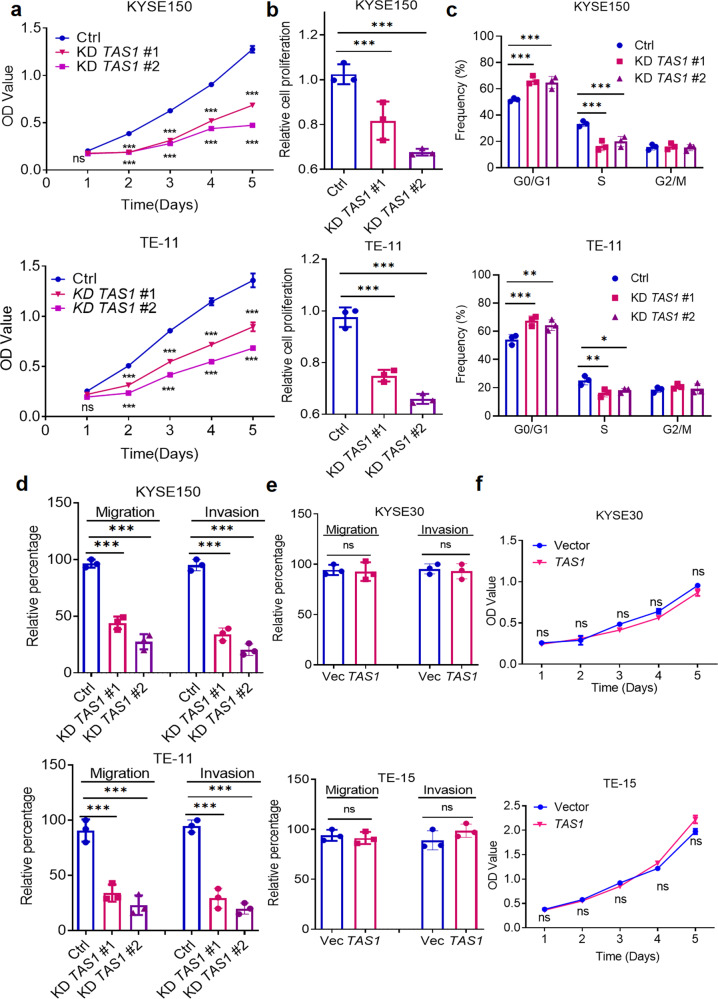
Fig. 2. TAS1 promotes cell proliferation, migration and invasion in vitro.
a MTS assays were performed to measure the proliferation (OD 490 nm) of KYSE150 and TE-11 cells with TAS1 knockdown (KD) compared with control cells (n = 3). b BrdU incorporation assays (OD 450 nm) of KYSE150 and TE-11 cells with TAS1 KD compared with control cells (n = 3). c Statistical analysis of the cell cycle distribution (%) of KYSE150 and TE-11 cells with TAS1 KD compared with control cells. d Statistical analysis of the migration and invasion rates (%) of KYSE150 and TE-11 cells with TAS1 KD (n = 3). e Statistical analysis of the migration and invasion rates (%) of KYSE30 and TE-15 cells with TAS1 overexpression (OE) (n = 3). f MTS assays were performed to measure the proliferation of KYSE30 and TE-15 cells with TAS1 OE compared with control cells (n = 3). The data are presented as the mean±S.D. values. *P < 0.05; **P < 0.01; ***P < 0.001; ns, not significant.

