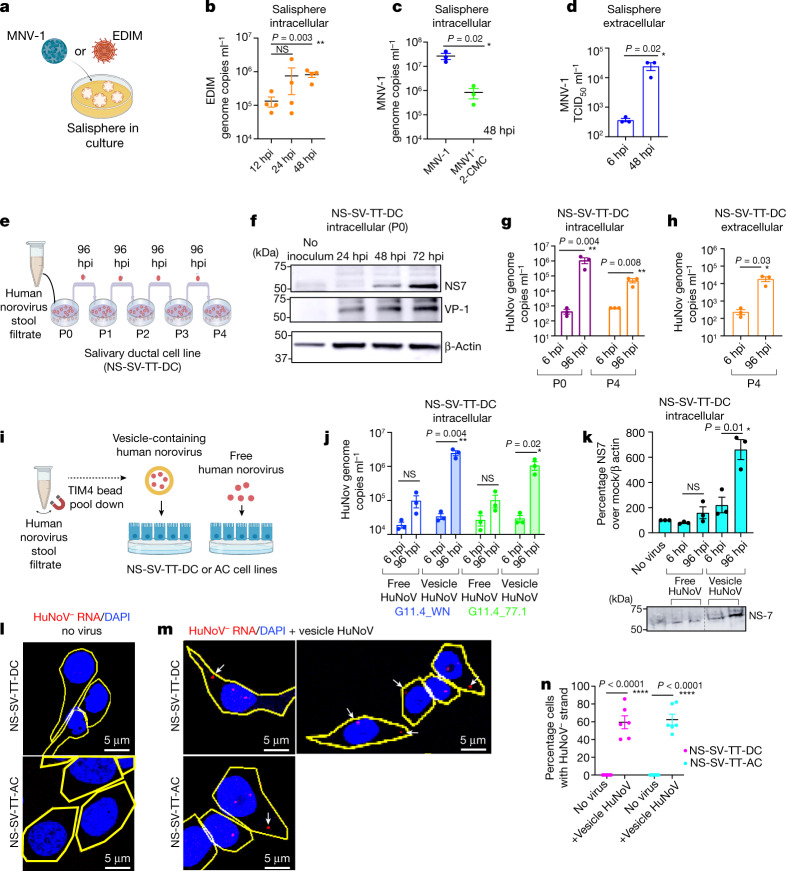
Fig. 4. Enteric viruses replicate in salispheres and SG cell lines.
a, Schematic of MNV-1 or EDIM inoculation in salispheres. b, EDIM genome copies in EDIM-inoculated salisphere lysates (n = 4). c, MNV-1 replication in salispheres with 2-CMC (n = 3). d, MNV-1 titres in MNV-1-inoculated salisphere supernatants (n = 3). e, NS-SV-TT-DC inoculation scheme with HuNoV. f, Immunoblot of P0 cell lysates probed with anti-NS7 and anti-VP1. β-Actin was used as the loading control (n = 3). g,h, HuNoV genomic RNA levels in P0 and P4 cell lysates (g) and P4 supernatants (h) (n = 3). i, Scheme of vesicle pulldown with TIM-4 beads from stool filtrate11. j, HuNoV genomic RNA levels in cell lysates of vesicle-cloaked or free virus-inoculated NS-SV-TT-DC cultures (n = 3). k, Cellular lysates of vesicle-cloaked or free virus-inoculated NS-SV-TT-DC cultures were analysed by immunoblotting with anti-NS7 (n = 3) and anti-β-actin. l,m, FISH with probes against the (−) HuNoV strand was performed on uninoculated (l) and vesicle-cloaked HuNoV (GII.4-WN)-inoculated (m) NS-SV-TT-DC and NS-SV-TT-AC cell cultures. Cell outlines are shown in yellow; the arrows point to (−) HuNoV RNA. n, Percentage of NS-SV-TT-DC and NS-SV-TT-AC cells with (−) HuNoV strand FISH staining (n = 6). Data are the mean ± s.e.m. b–d,g,h,j,k,n, Each dot represents a biologically independent experiment; two-tailed unpaired t-test between two groups. Statistical information is shown in Supplementary Table 4. d,g,h,j,k, The input was 6 hpi. b,c,g,h,j, The LOD for qPCR was 102 genome copies ml−1. d, The LOD for TCID50 per millilitre was 2 × 10². All micrograph experiment reproducibility information is found in the Methods. For gel source data, see Supplementary Figure 1.

