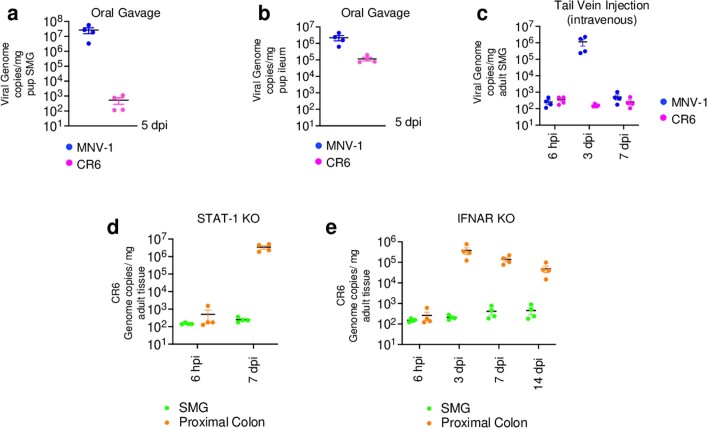
Extended Data Fig. 2. Investigating SMG infection of CR6.
MNV-1 and CR6 viral genome copies were measured in a, SMG and b, ileum of orally inoculated mice (n = 2, with 2 animals/experiment, each data point represents data from 1 animal. Data are mean ± SEM). Similarly in c, viral genome copies for MNV-1 and CR6 were measured in SMGs after tail vein injection of each virus (n = 4, with 3 animals/experiment each dot represents data from 1 animal. Data are mean ± SEM). CR6 genome copies were measured in d, STAT-1, and e, IFNAR knockout mice. In both experiments animals were orally gavaged and SMG and proximal colon tissues monitored for replication. For d, n = 2 with 2 animals/ experiment and e, n = 4 with 4 animals/ experiment, each dot represents data from 1 animal. Data are mean ± SEM. Input for c, d, e is 6 hpi. a–e, The LOD for qPCR data is 78 ± 9 (s.e.m) genome copies mg−1 tissue.

