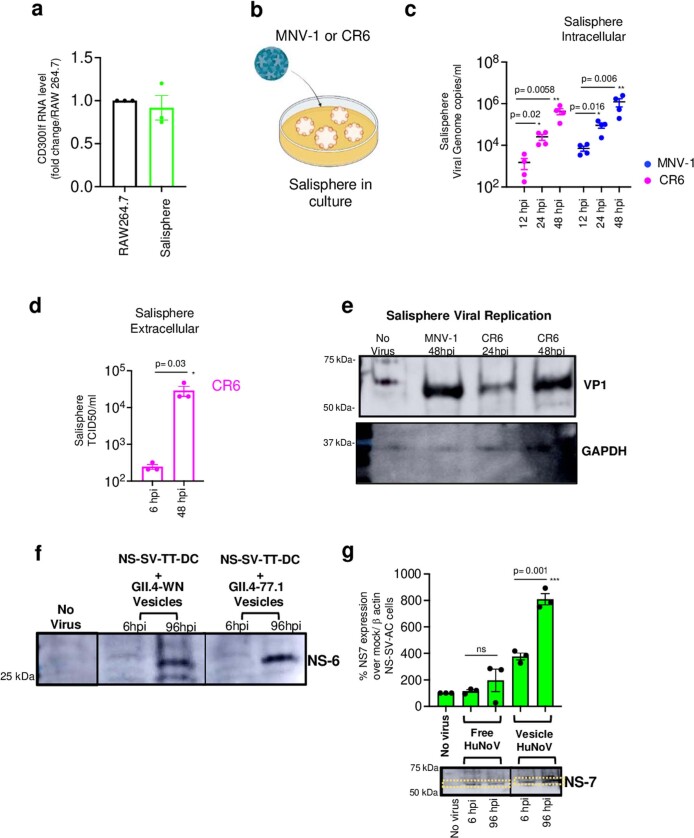
Extended Data Fig. 4. Ex-vivo replication of MNV-1, CR6 and human norovirus.
a, CD300lf expression in uninoculated salispheres (from 3 independent). RAW246.7 cells were used as positive control for comparison. Bar graph is mean ± SEM. b, Schematic of MNV-1/CR6 inoculation into salisphere culture. c, CR6 and MNV-1 replication in salispheres (from 4 independent experiments represented by a dot). Genome copies/ml was calculated based on standard curve plotted on log scale. Dot plots are mean ± SEM. d, Supernatants collected from CR6 inoculated salispheres (3 independent experiments, each dot represents an experiment) and analyzed by TCID50 and plotted on log scale. Bar graphs are mean ± SEM. e, Immunoblots of lysates from MNV-1 (48hpi) and CR6 (24 hpi & 48 hpi) inoculated salisphere cultures probed against VP-1 and GAPDH (blot representative of 2 independent experiments). f, Lysates from NS-SV-TT-DC cultures inoculated with vesicle-cloaked human noroviruses from two separate isolates (GII.4-WN and GII. 4-77.1) for 6 hpi and 96 hpi (but washed at 6 hpi) were probed with anti-NS6 antibody (from 3 independent experiments). g, Lysates from NS-SV-TT-AC cultures inoculated with vesicle-cloaked human noroviruses from isolate (GII. 4-77.1) for 6 hpi and 96 hpi (but washed at 6 hpi) were probed with anti-NS7 and anti-β actin (from 3 independent experiments represented by each dot) and analyzed by densitometry (dashed line box) and plotted as a bar graph; mean ± SEM. Samples were derived from the same experiment and blots were processed in parallel. Statistical test was performed using two-tailed unpaired t-test between 6 hpi and 96 hpi for each inoculum groups. Statistical information is in Supplementary Table 4. For gel source data, see Supplementary Figure 1. Input for d, g is 6 hpi and c is 12 hpi. c, The LOD for qPCR data from salisphere was 102 genome copies ml−1. d, The LOD for TCID50 ml−1 was approximately 2 x 10².

