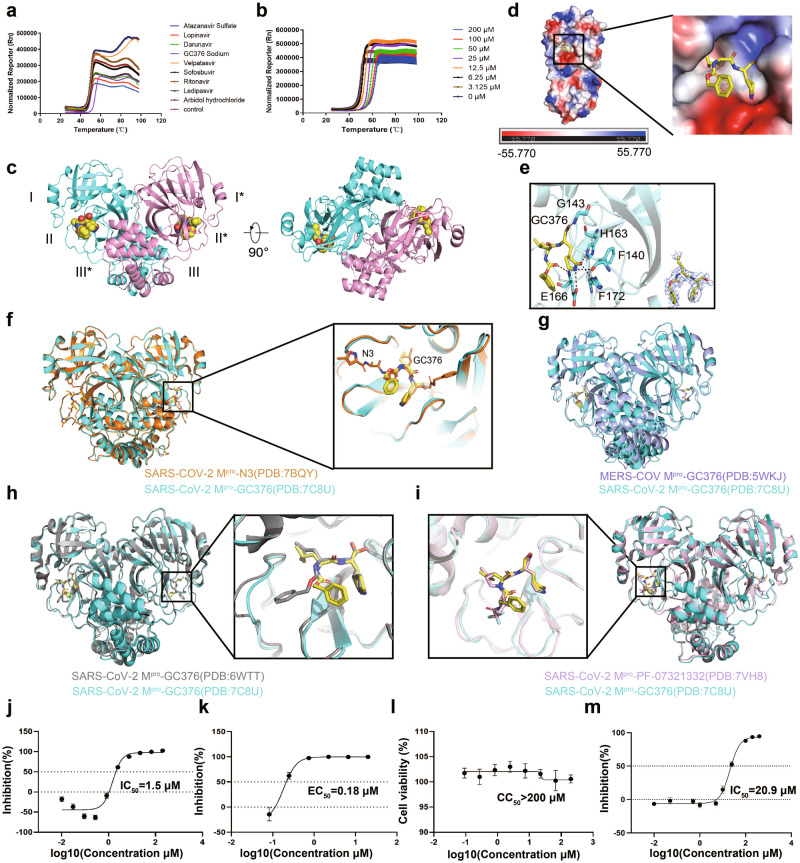
Fig. 1. Structure of SARS-CoV-2 Mpro and GC376 activity.
a Thermal shift assay of SARS-CoV-2 Mpro with different drugs. b Thermal shift assay of SARS-CoV-2 Mpro with different concentrations of GC376. c Overall structure of SARS-CoV-2 Mpro in complex with GC376 in two different views. d Electrostatic surface of SARS-CoV-2 Mpro. Blue: positive charge potential; Red: negative charge potential. The value ranges from −55.77 (red) to 0 (white) to 55.77 (blue). e Binding of GC376 (yellow sticks) to the SARS-CoV-2 Mpro pocket with the electron density map for GC376. f Comparison between SARS-CoV-2 Mpro-GC376 and SARS-COV-2 Mpro-N3 crystal structures. g Comparison between SARS-CoV-2 Mpro-GC376 and MERS-COV Mpro-GC376. h Comparison of the SARS-COV-2-GC376 structure we reported (PDB: 7CBU) to the SARS-COV-2-GC376 structure reported by Ma et al. (PDB:6WTT). i Comparison of SARS-CoV-2 Mpro-GC376 and SARS-CoV-2 Mpro-PF-07321332. j IC50 of GC376 on the purified Mpro enzyme. k EC50 of GC376 on inhibition of SARS-Cov-2 in Vero E6 cells. l CC50 of GC376 on Vero E6 cells. m IC50 of GC376 on the purified Mpro P132H.

