
Fig. 12.
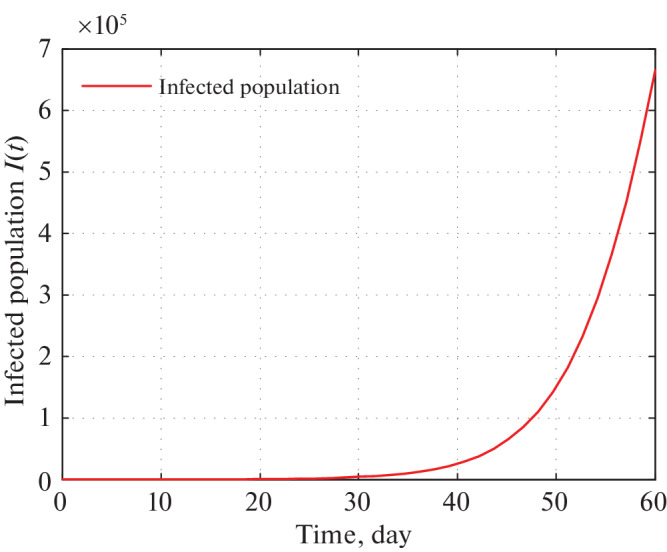
Time series plot of infected population in Uttar Pradesh for α = 0.000000020 using data from Tables 5–7 for two months period from 22 March, 2020.
Official websites use .gov
A
.gov website belongs to an official
government organization in the United States.
Secure .gov websites use HTTPS
A lock (
) or https:// means you've safely
connected to the .gov website. Share sensitive
information only on official, secure websites.
Time series plot of infected population in Uttar Pradesh for α = 0.000000020 using data from Tables 5–7 for two months period from 22 March, 2020.