Fig. 15.

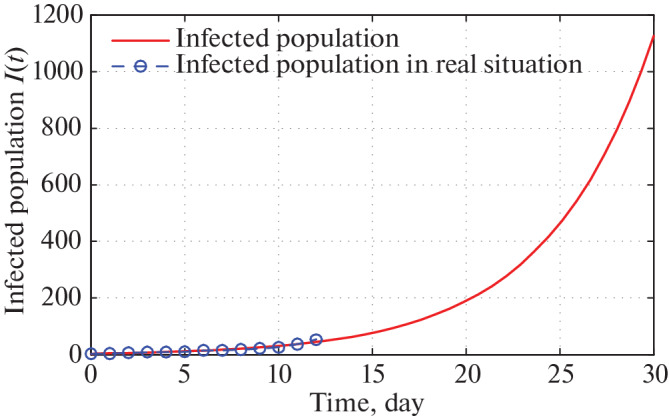
Time series plot of infected population in West Bengal for α = 0.0000000047 with initial conditions, parameter values are given in Tables 5–7 respectively for one month period from 21 March, 2020.

Time series plot of infected population in West Bengal for α = 0.0000000047 with initial conditions, parameter values are given in Tables 5–7 respectively for one month period from 21 March, 2020.