
Fig. 6.
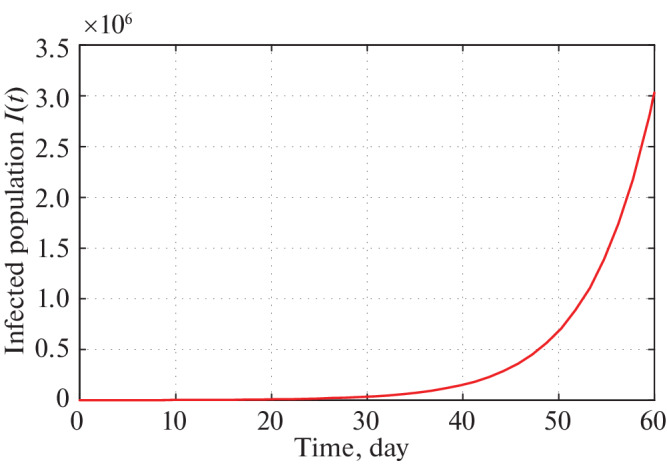
Time series plot of infected population for α = 2.5 × 10⁻¹⁰ with initial conditions, parameter values are given in Tables 2 and 3 respectively for two months period.
Official websites use .gov
A
.gov website belongs to an official
government organization in the United States.
Secure .gov websites use HTTPS
A lock (
) or https:// means you've safely
connected to the .gov website. Share sensitive
information only on official, secure websites.
Time series plot of infected population for α = 2.5 × 10⁻¹⁰ with initial conditions, parameter values are given in Tables 2 and 3 respectively for two months period.