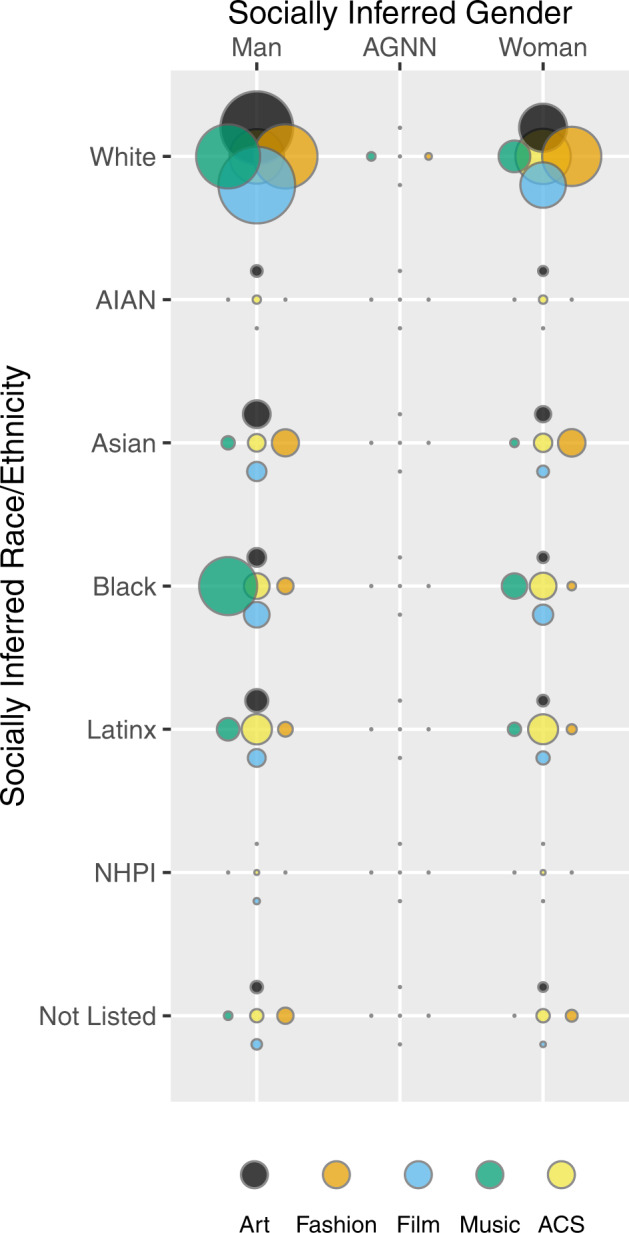
Fig. 4. Socially inferred intersecting gender and ethnicity data compared across domains and to American Community Survey (ACS) data (U.S. Census Bureau, 2019).

At each categorical intersection point, the black bubble represents the share of that identity group within the U.S. population, and the colored bubbles represent the shares within each creative domain. See Table 1 for numerical data. Note: AGNN agender, gender nonconforming, or nonbinary, AIAN American Indian/Alaska Native, NHPI Native Hawaiian/Pacific Islander, Not Listed an identity not captured by the other choices.
