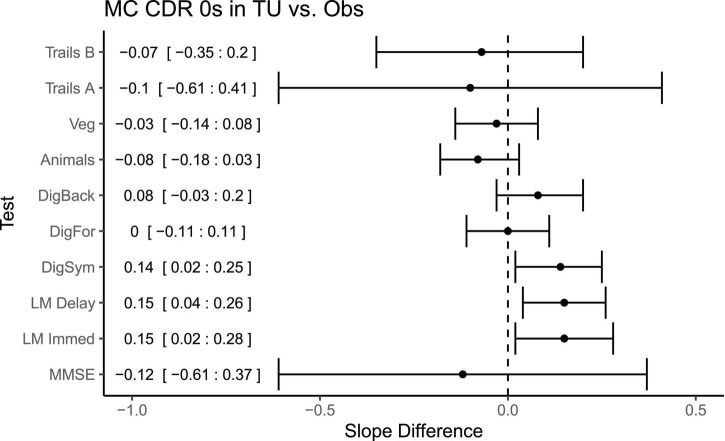
FIGURE 5.
Differences in slopes (and 95% CIs) for each test between CDR 0 mutation carriers in TU vs. the Obs study. A positive slope difference indicates a larger or more positive slope (improvement) in the TU compared to the Obs study. Some tests, such as Logical Memory and Digit Symbol, had more improvement or practice effects in the TU vs. Obs. Mean differences and 95% CIs presented along the left side of the graph.

