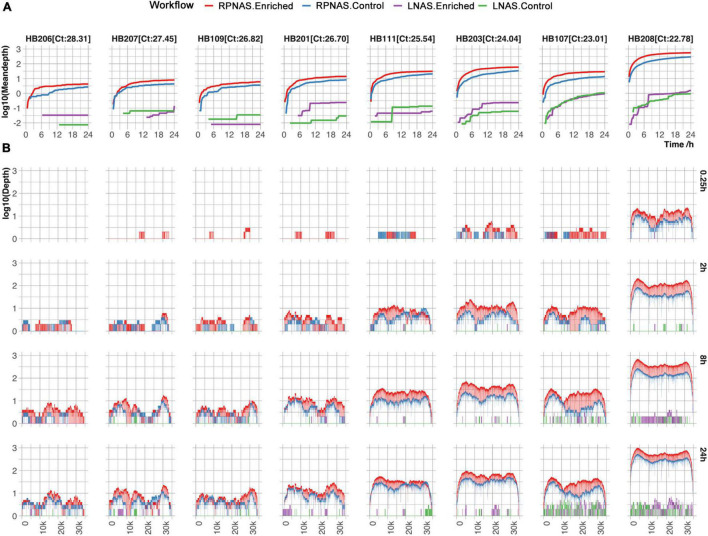
FIGURE 3.
Comparison of HAdV enrichment in eight samples with different workflows. (A) The mean depth of the HAdV genomes changed over 24 h of sequencing. (B) Coverage of HAdV genomes at the different timestamps (0.25, 2, 8, and 24 h). Red, blue, purple, and green lines represent the enriched group in RPNAS workflow, the control group in RPNAS workflow, the enriched group in LNAS workflow, and the control group in LNAS workflow, respectively.

