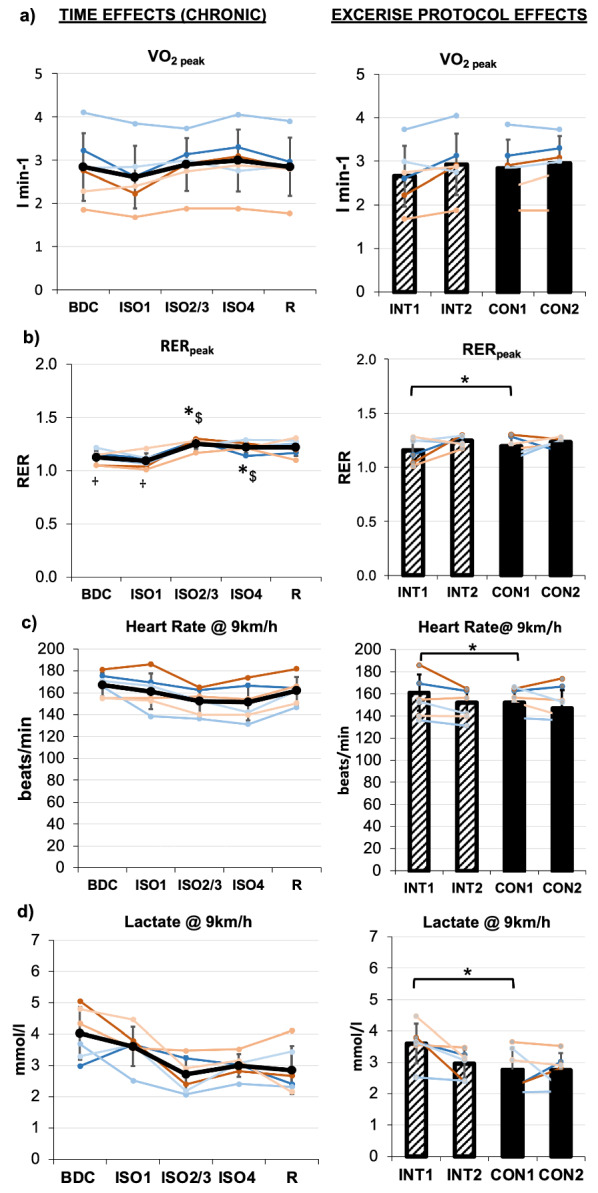
Fig. 3:

a Results of physical performance test regarding peak oxygen uptake (VO2peak), b peak respiratory exchange ratio (RERpeak), c heart rate @ 9 km/h and 3d) lactate @ 9 km/h. Chronic effects over TIME are displayed on the left, exercise PROTOCOL effects on the right, respectively. Means are indicated in black line or bar graphs, female individuals are shown in red shades, male individuals in blue shades. TIME effects are presented for assessments during baseline data collection (BDC), at the beginning of isolation (ISO1), at midterm (ISO2/3), at the end (ISO4) and during the recovery phase (R). For exercise PROTOCOL effects comparing interval (INT, stripped bars) and continuous (CON, full bars) protocols, the mean at the beginning (INT1, CON1) and end (INT2, CON2) of each protocol is displayed. Error bars indicate standard deviation. Significant differences to BDC are indicated by *, to ISO1 by $, and to R by †
