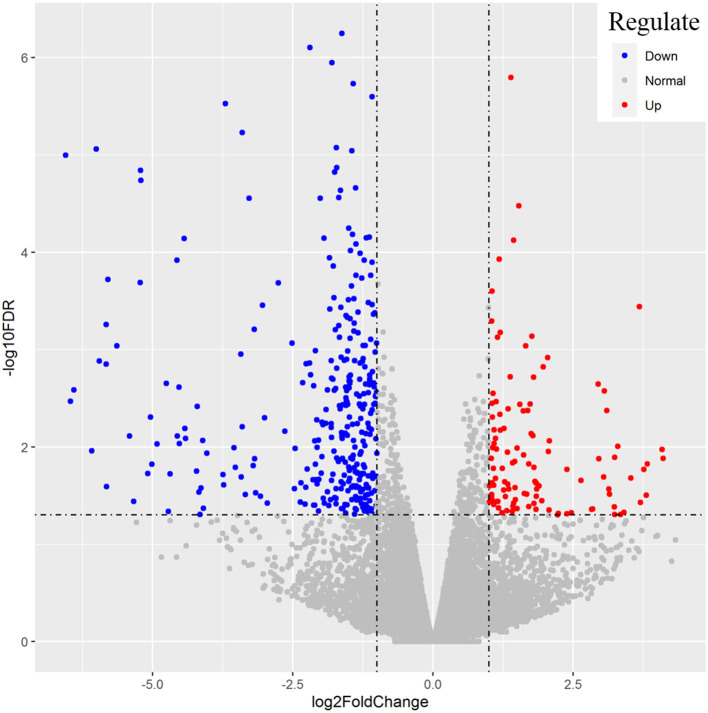
Figure 3.
Representation of the differentially expressed genes between the H and L groups. The x-axis values are the log2 (fold change) and the y-axis values are –log10 FDR. Genes with higher expression levels in H group compared with L group were denoted as “up-regulated” and indicated in red, while those with lower expression levels in H group were “down-regulated” and indicated in blue.

