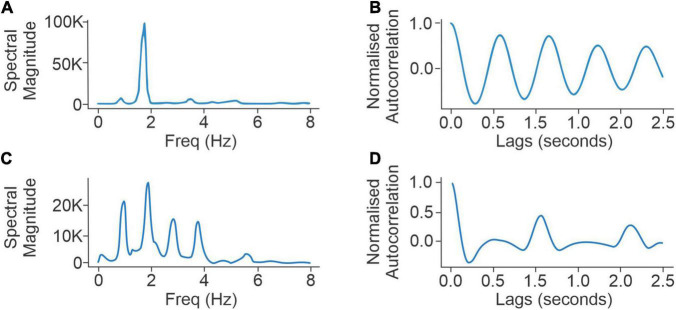
FIGURE 1.
Panels (A,B) compare the spectral densities (left) and autocorrelation function (right) of a normal walker with low scores for UPDRS III questions for axial rigidity (UPDRS III 3a–3e = 2), postural stability (UPDRS III 3.10-12 = 1), UPDRS III (overall) (=20), and low FoG score (=5). Panels (C,D) compare the spectral densities (left) and autocorrelation function (right) of an abnormal walker with high responses to UPDRS III questions for axial rigidity (UPDRS III 3a–3e = 11) and postural stability (UPDRS III 3.10-12 = 4), UPDRS III (overall) (48), and high FoG score (=11).

