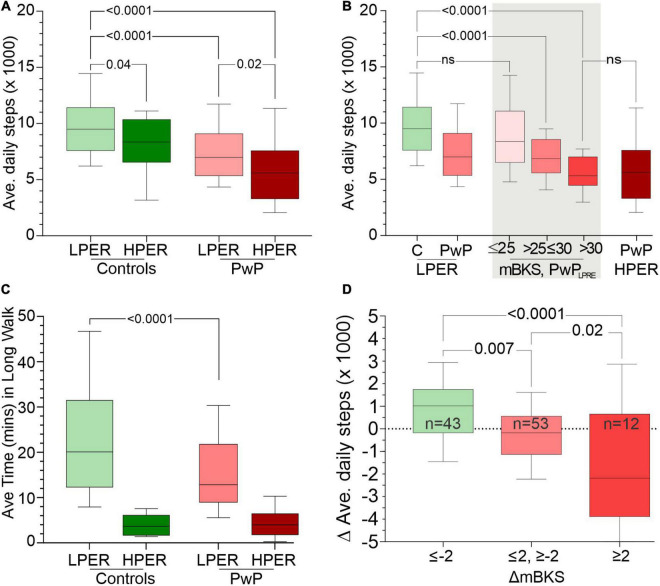
FIGURE 2.
Panel (A) shows the average daily step count (y-axis) of CLPER, CHPER, PwPLPER, and PwPHPER participants. Panel (B) compares the average daily step count (y-axis) of CLPER, all PwPLPER, PwPLPER stratified according to the PKG’s score for bradykinesia (mBKS) in the shade areas and PwPHPER. Note that the distribution of PwPLPRE with mBKS ≤ 25 has a similar distribution to that of CLPER, whereas those with the highest mBKS have a distribution similar to PwPHPER. Panel (C) shows the average time spent each day in long walks (walks > 1 min, y-axis) of CLPER, CHPER, PwPLPER, and PwPHPER participants. Panel (D) shows the change (Δ) in average step count from before treatment to after treatment (y-axis: a positive number indicates an increase in step count). PwPLPRE were sorted into three categories based on change (Δ) in mBKS from before treatment to after treatment where a negative (Δ) indicates an improvement in mBKS (and bradykinesia). All plots are box (median, 25th, 75th percentiles) and whiskers (10th and 90th percentiles) plots. The statistical differences between relevant plots are shown by p-values obtained from an ANOVA and Šídák’s multiple-comparisons post hoc test.

