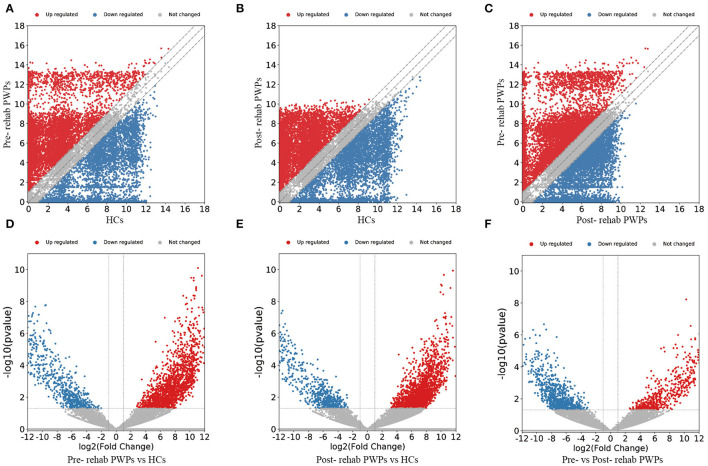
Figure 2.
Changes in the mRNA expression profiles of the HCs, pre- and post-rehab PWPs. The scatter plot (A) and volcanic map (D) reveal that a significant difference existed in the distribution of mRNAs between pre-rehab PWPs and the HCs. The scatter plot (B) and volcanic map (E) reveal that a significant difference existed in the distribution of mRNAs between Post-rehab PWPs and the HCs. The scatter plot (C) and volcanic map (F) reveal that a significant difference existed in the distribution of mRNAs between pre- and post-rehab PWPs. Red represents upregulation, while green represents downregulation. Pre-rehab, pre-rehabilitation; Post-rehab, post-rehabilitation; PWPs, patients with Parkinson's disease.

