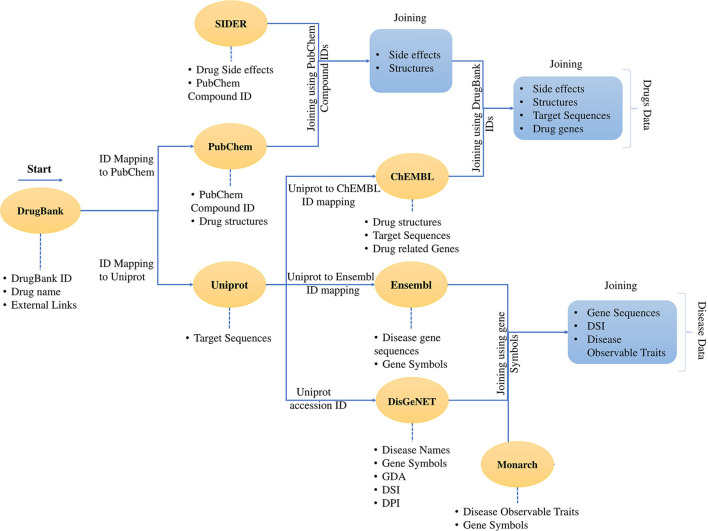
Figure 2.
Process of data collection and data mapping. It shows the creation of a dataset and merging of different data sources using cross-database identifiers. The dataset contains the data for the drugs and the data for the diseases. The data download was started with DrugBank data with external links. Then the data was mapped to PubChem and Uniprot. It was followed by the mapping of the SIDER data using the PubChem IDs and the mapping continues through ChEMBL and all the four drug features are presented in a tabular form with identifiers from mentioned databases. The same process follows for the disease data, and finally, the disease data is also represented in the tabular form. The developed dataset contains the drug and disease-related data enriched with various features.

