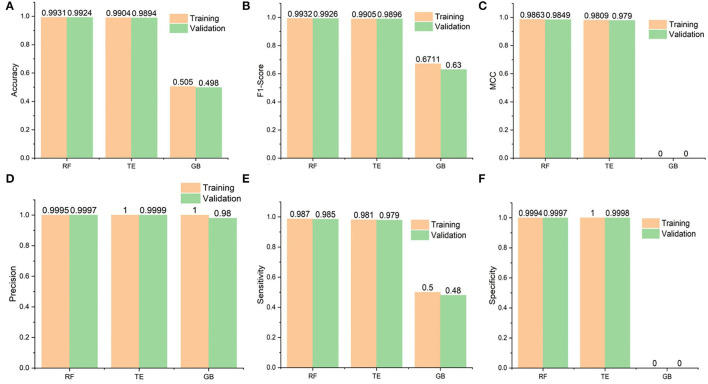
Figure 3.
Performance statistics of the algorithms used in the study. Additionally, it shows the training and 10-fold cross-validation results of the Random Forest (RF), Tree Ensemble (TE), and Gradient Boosted (GB) classifiers. (A) Shows the accuracy results of the classifiers and RF seems to perform best followed by the Tree Ensembl predictor, (B) in case of F1 scores, RF again performs better than the rest whereas the GB performance is worst, (C) whereas MCC values are also best for the RF but (D) Precision results are best for the TE during training and validation followed by the RF and GB, finally (E,F) for the Sensitivity and specificity, respectively, RF performs best and GB is constantly worst.

