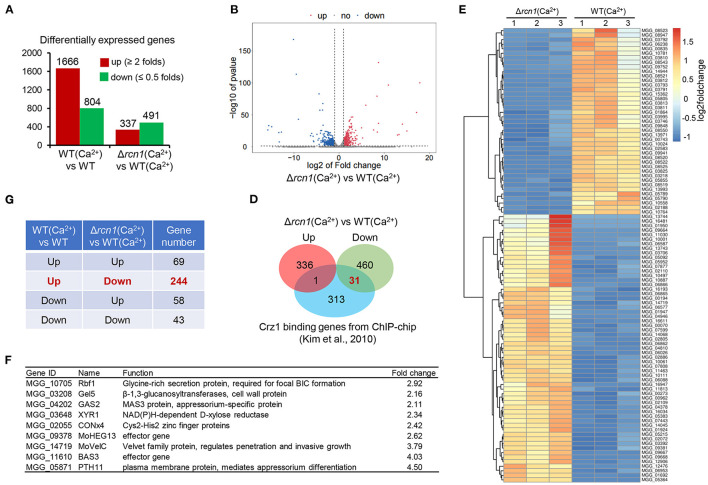
Figure 8.
Integrative analysis of RNA-seq genes affected by calcium in WT and ΔMorcn1 mutants. (A) Differentially expressed genes of different comparing pairs obtained from RNAseq data. (B) Expression fold changes of genes in ΔMorcn1 induced by Ca2+ compared with WT induced by Ca2+ (|log2[FC]| > 1; p-adj <0.05). (C) Gene numbers shared in different comparing pairs of upregulated or downregulated genes in (A). (D) Overlap of MoRCN1-regulated and Crz1-regulated genes reported by Kim et al. (2010). (E) Heatmap shows hierarchical clustering of genes from transcriptome data. WT (Ca2+), the wild type strain induced by CaCl2; ΔMorcn1 (Ca2+), the ΔMorcn1 mutants induced by CaCl2. (F) Previously reported pathogenesis genes in differentially expressed genes of ΔMorcn1(Ca2+) compared with WT(Ca2+).

