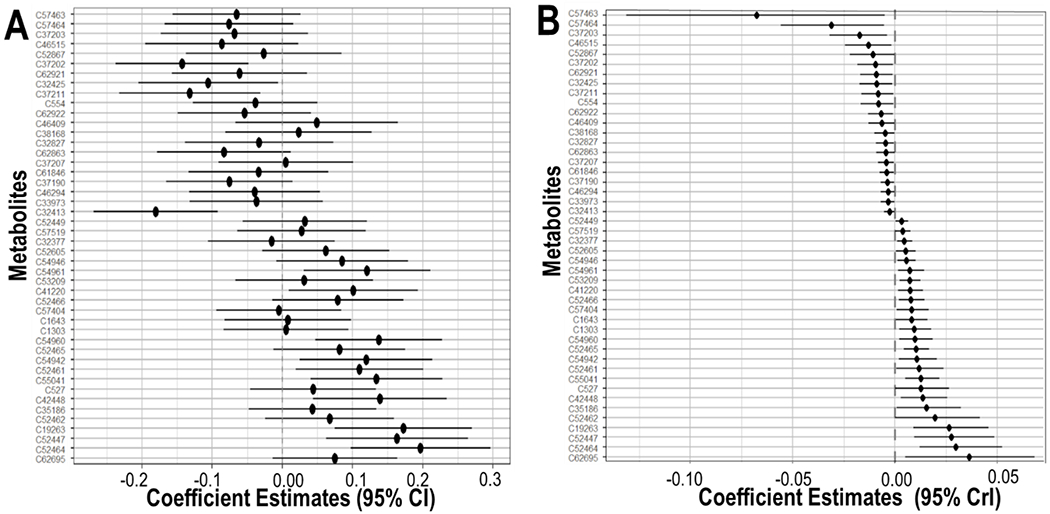
Fig. 3. Comparison between the metabolite-wide association study (A) and Bayesian factor analysis for interaction (B).

Each plot shows the association between individual prenatal maternal serum metabolites and sex-specific birthweight for gestational age z-score at a 5% significance threshold. All analyses were adjusted for maternal age, ethnicity, education level and week of serum collection.
