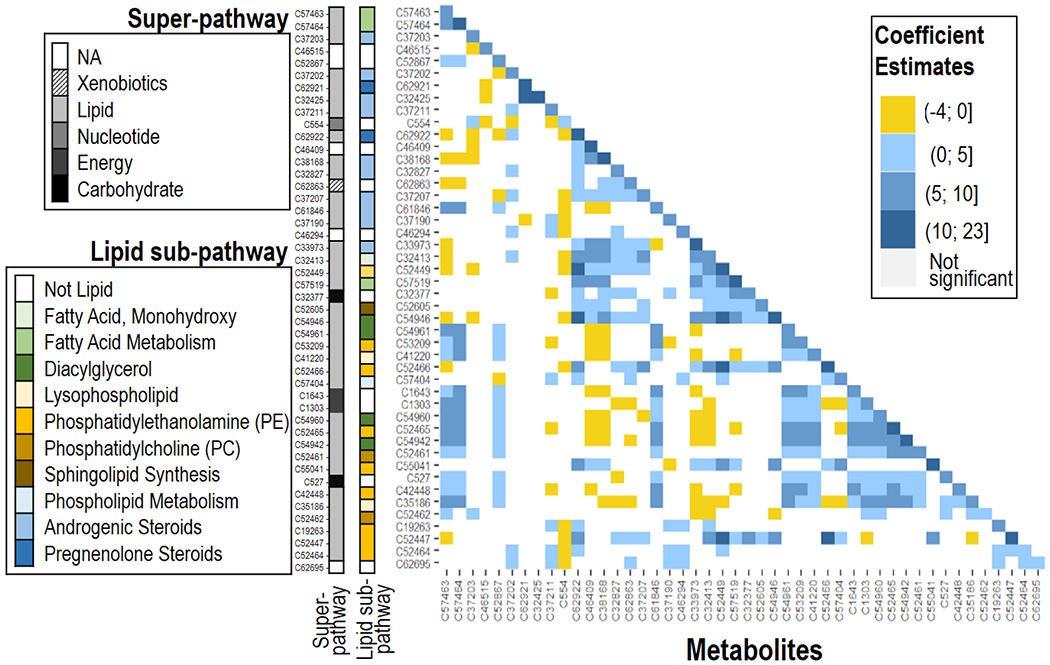
Fig. 4.

Nonlinear and synergistic relationships between individual metabolites and the birthweight Fenton z-score. Squares on left-to-right diagonal identify the coefficients of the quadratic term; squares outside the left-to-right diagonal identify the coefficients of the interaction between the corresponding metabolites. Individual and multiplicative associations between metabolites and birthweight Fenton z-score were at 5% significance threshold. All analyses were adjusted for maternal age, ethnicity, education levels, pre-pregnancy body mass index, and week of serum collection.
