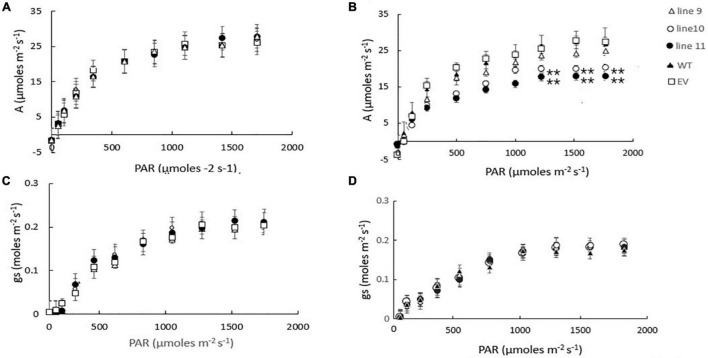
FIGURE 7.
A comparison of the light saturation curves for photosynthesis (A,B) and stomatal conductance (C,D) in wild type barley plants (WT), transgenic lines expressing the Arabidopsis LEA 5 sequence (lines 9, 10, and 11) and empty vector (EV) controls. Plants were grown for either 14 days under well-watered conditions (A,C) or for 7 days under well-watered conditions followed by 7 days without watering (B,D). Asterisks indicate significant differences between the transgenic lines and control as estimated by the Student’s t-test (**p < 0.01).

