Figure 2.
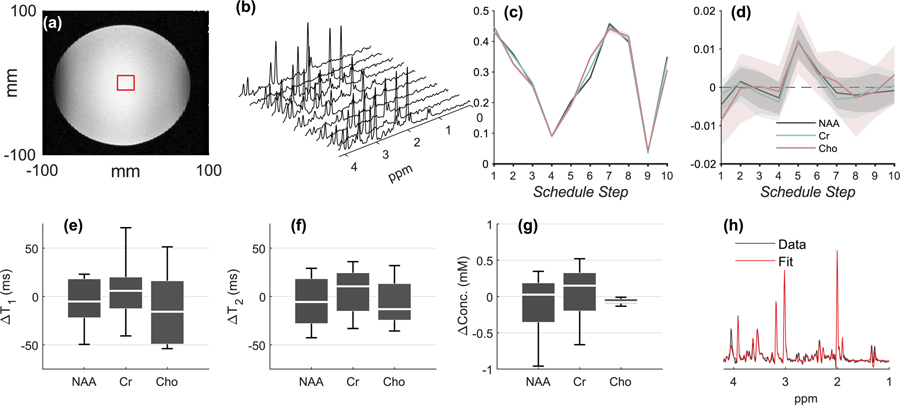
Phantom results. (a.) Voxel placement. (b.) Spectra from all Nent=10 schedule entries from a single MRSF acquisition, after summation of Navg=20 averages. (c.) The normalized fingerprints of NAA, Cr and Cho from all Nrep=22 repetitions (mean±standard deviation). The similarity between different scans is so high that the outlines of the standard deviation can barely be seen. (d.) The mean±standard deviation of the residual for NAA, Cr, Cho, taken over Nrep=22 repetitions. All non-zero residuals are either within 1–2 standard deviations from zero, indicating the overall robustness of the dictionary fitting process. (e.) Box plots (median, inter-quartile range and whiskers) for , the difference between the estimated and “true” T1 in the phantom (as measured using a long inversion recovery experiment), from all Nrep=22 repetitions. The schedule’s precision (standard deviation) is reflected by the width of the boxplot, while its accuracy (bias) is reflected by its distance from the line. (f,g.) Boxplots for (as measured by a long multi-echo single voxel experiment) and ∆concentrations. (h.) Summed TE=35 ms schedule entries and corresponding LCModel fit from one of the 5-minute Nrep=22 repetitions. This fit was used to assess concentrations, as explained in the Methods section.

