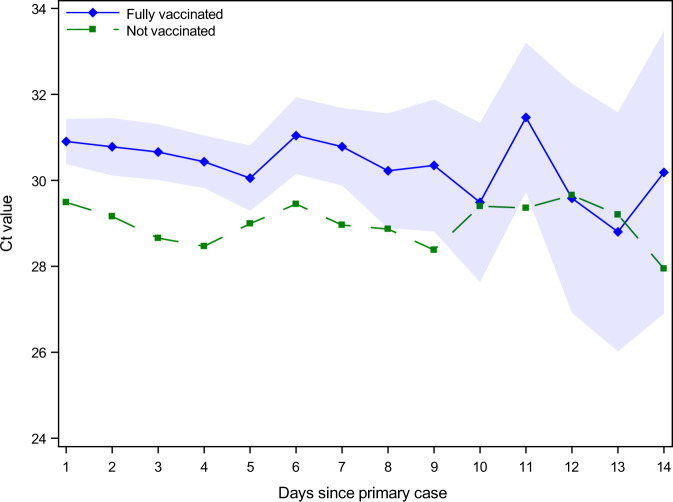
Fig. 2. Ct values across vaccinated and unvaccinated positive secondary cases.
The Ct values in samples for positive secondary cases of unvaccinated and fully vaccinated follow the same pattern, indicating that the higher Ct values for fully vaccinated individuals is consistent and unrelated to the time of testing positive. Markers present point estimates, while shaded areas are 95%-confidence intervals clustered on the household level. Regression estimates include age fixed effects. Table S4 provides regression estimates of the increased Ct values for vaccinated secondary cases.

