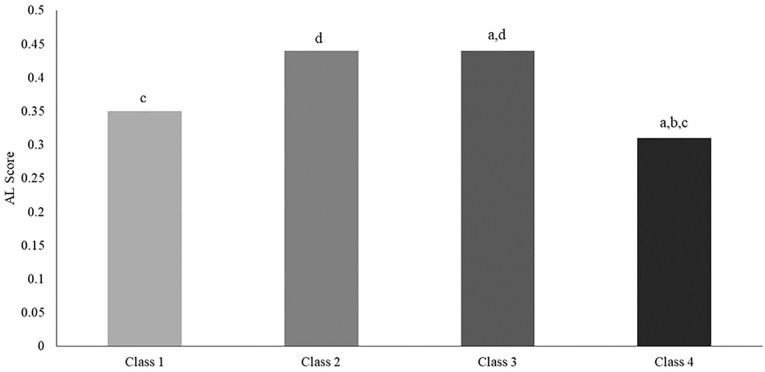
Figure 2.
Mean Allostatic Load (AL) by Psychosocial Resource Latent Classes Among African American Men.
Note. Data: Nashville Stress and Health Study (2011–2014; N = 283). Results indicate the following about each latent class: Class 1: n = 90, m = 0.35, SE = 0.04; Class 2: n = 37, m = 0.44, SE = 0.04; Class 3: n = 58, m = 0.44, SE = 0.03; Class 4: n = 98, m = 0.31, SE = 0.03. The letters above each bar indicate statistically significant differences at p < .05. (a) Denotes that the AL of members in this class is significantly different from the AL of Class 1 members; (b) indicates significant differences from Class 2; (c) indicates significant differences from Class 3; (d) indicates significant differences from Class 4.

