
FIGURE 5.
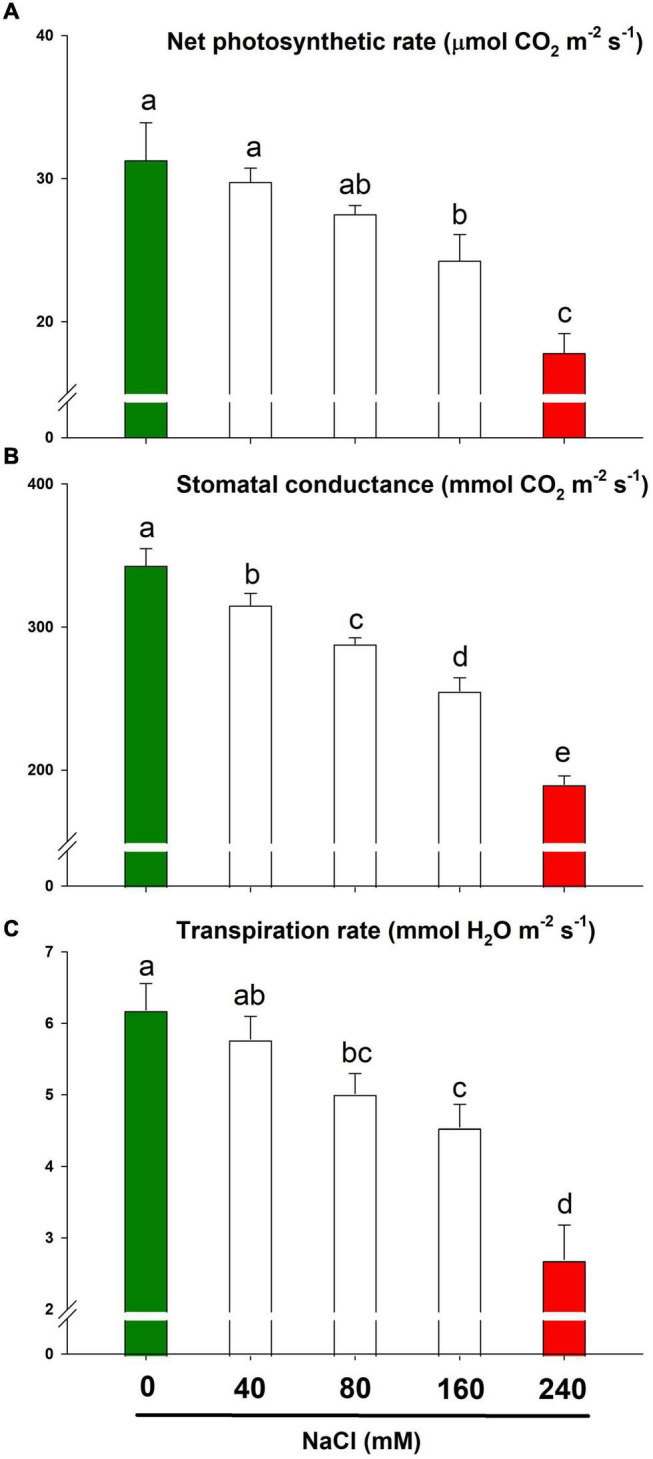
The gas exchange response of lemongrass to NaCl concentrations (0, 40, 80, 160, and 240 mM) with the focus on net photosynthetic rate (A), stomatal conductance (B), and transpiration rate (C). Each bar represents mean ± SE (n = 3). Means followed by the same letter(s) do not differ by LSD test at 5% probability level (α = 0.05). The colors are just visual ques for readers to quickly distinguish between control and most stressed treatment.