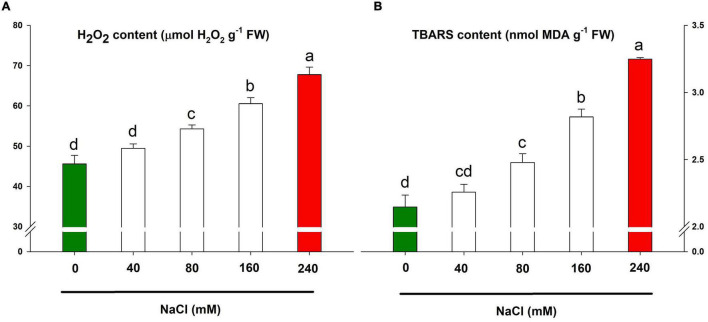
FIGURE 6.
Oxidative stress markers for assessing the salt-sensitivity in lemongrass plants. H2O2 content (A) and TBARS content (B) are depicted here. Each bar represents mean ± SE (n = 3). Means followed by the same letter(s) do not differ by LSD test at 5% probability level (α = 0.05). The colors are just visual ques for readers to quickly distinguish between control and most stressed treatment.

