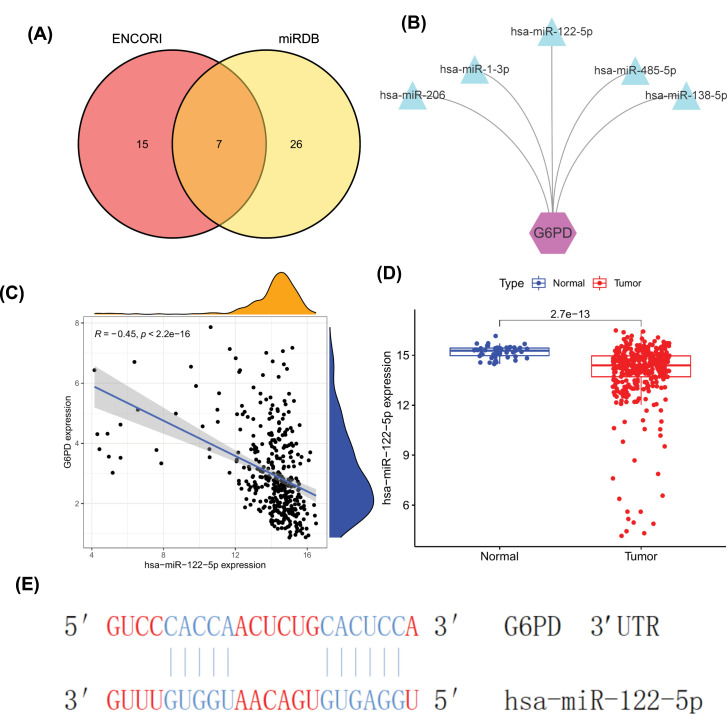
Figure 6. Prediction of key upstream miRNAs.
(A) Veen diagram shows overlapping miRNAs in two databases. MiRNAs regulating G6PD were predicted by ENCORI and miRDB databases, respectively. (B) Network diagram of 5 pairs of miRNAs combined with G6PD. (C) Scatter plot of correlation between miR-122-5p and G6PD expression (R = −0.45, P<2.2e−16). (D) Difference expression of miR-122-5p between HCC and normal tissues. Low expression of miR-122-5p in HCC (P=2.7e-13). (E) Map of binding sites of miR122-5p/G6PD.

