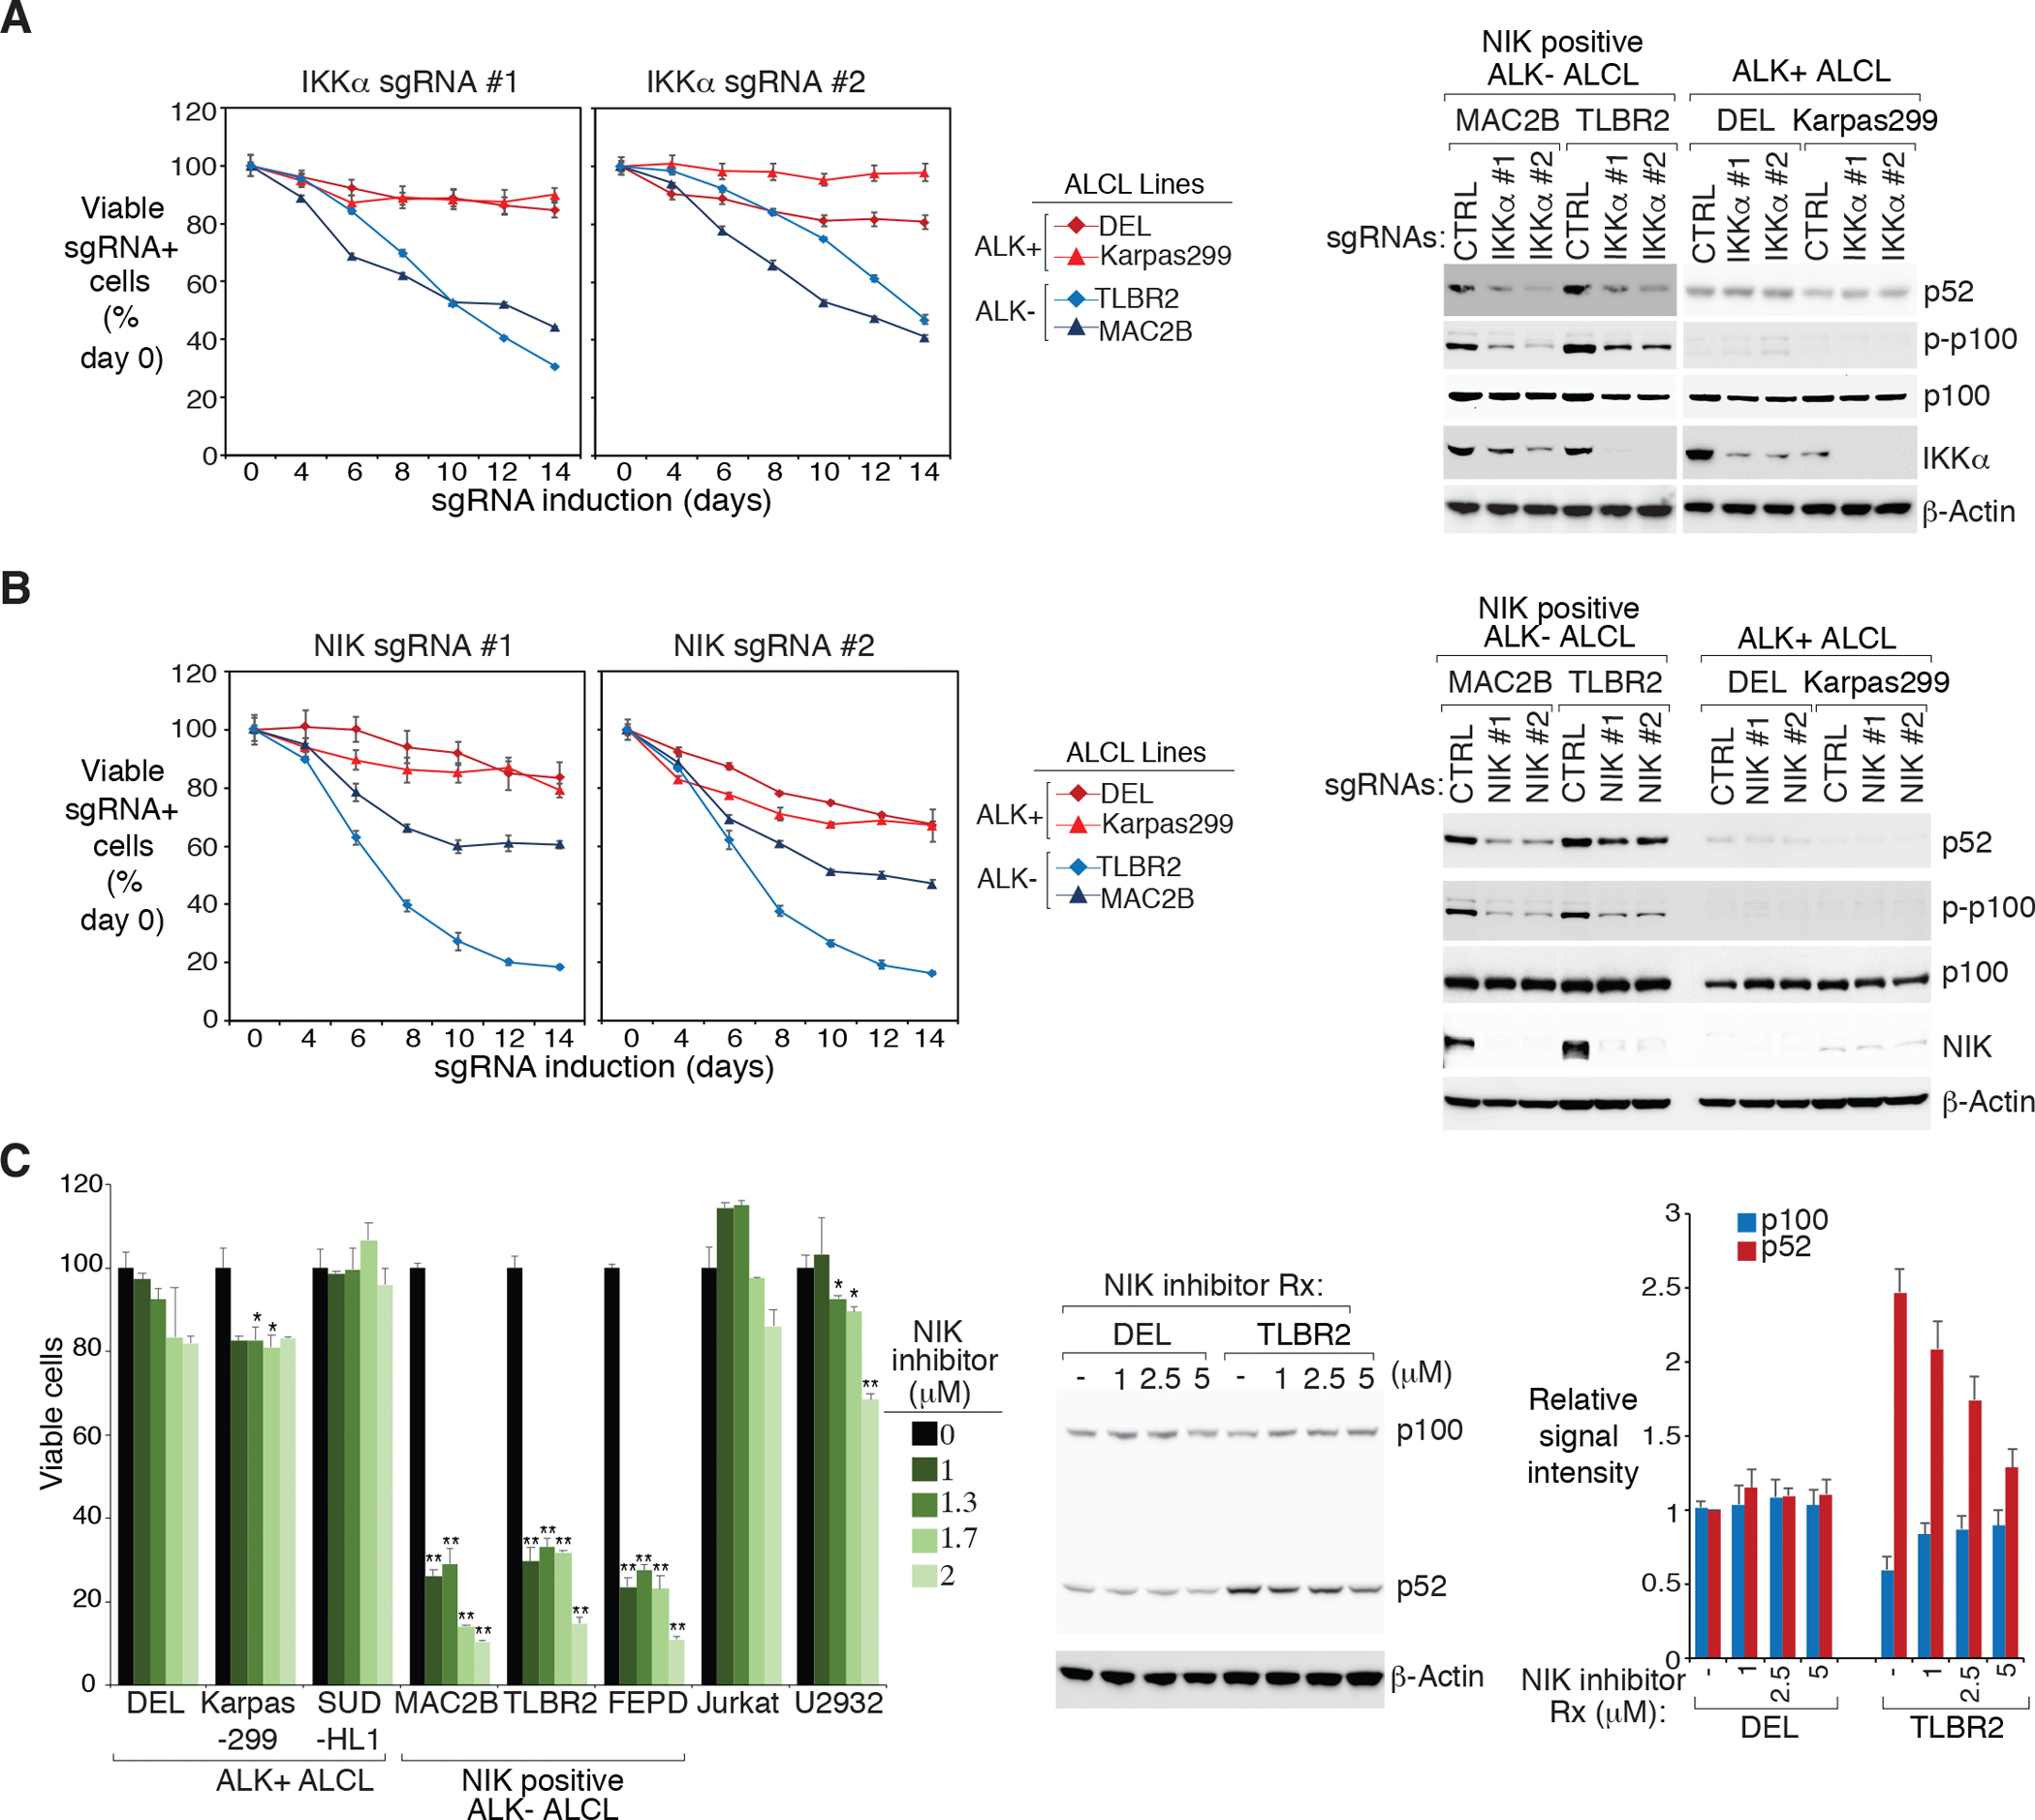
Figure 2: NIK-positive ALK− ALCL lines are more dependent on activated NIK-IKKα signaling.

A. left: Indicated ALCL lines were transduced with IKKα or Ctrl sgRNAs along with GFP. The fraction of viable sgRNA-expressing cells relative to the total viable cell fraction at indicated times following induction of the indicated sgRNAs, normalized to day 0 values. Error bars denote SD of triplicates. right: Indicated ALCL lines were transduced with IKKα or Ctrl sgRNAs, selected and expression induced. Lysates were analyzed by immunoblotting for the indicated proteins. B. left: Same as (A). Error bars denote SD of triplicates. right: Same as (A). Lysates were analyzed by immunoblotting for the indicated proteins. C. left: Indicated lines were treated with NIK inhibitor at the indicated concentrations for 4 days. Viability was measured by the MTS assay and normalized to DMSO-treated cells. Error bars denote SEM of triplicates. P were calculated comparing DMSO and treated groups; * indicates P < 0.05; ** indicates P < 0.01. right: ALK+ DEL and ALK− TLBR2 lines were treated with NIK inhibitor at the indicated concentrations overnight. Lysates were analyzed by immunoblotting for the indicated proteins. The relative p100 and p52 signal intensity (compared to β-actin) were determined by densitometric analysis, and normalized to untreated conditions in DEL line (right). Error bars denote SEM of three independent experiments.
