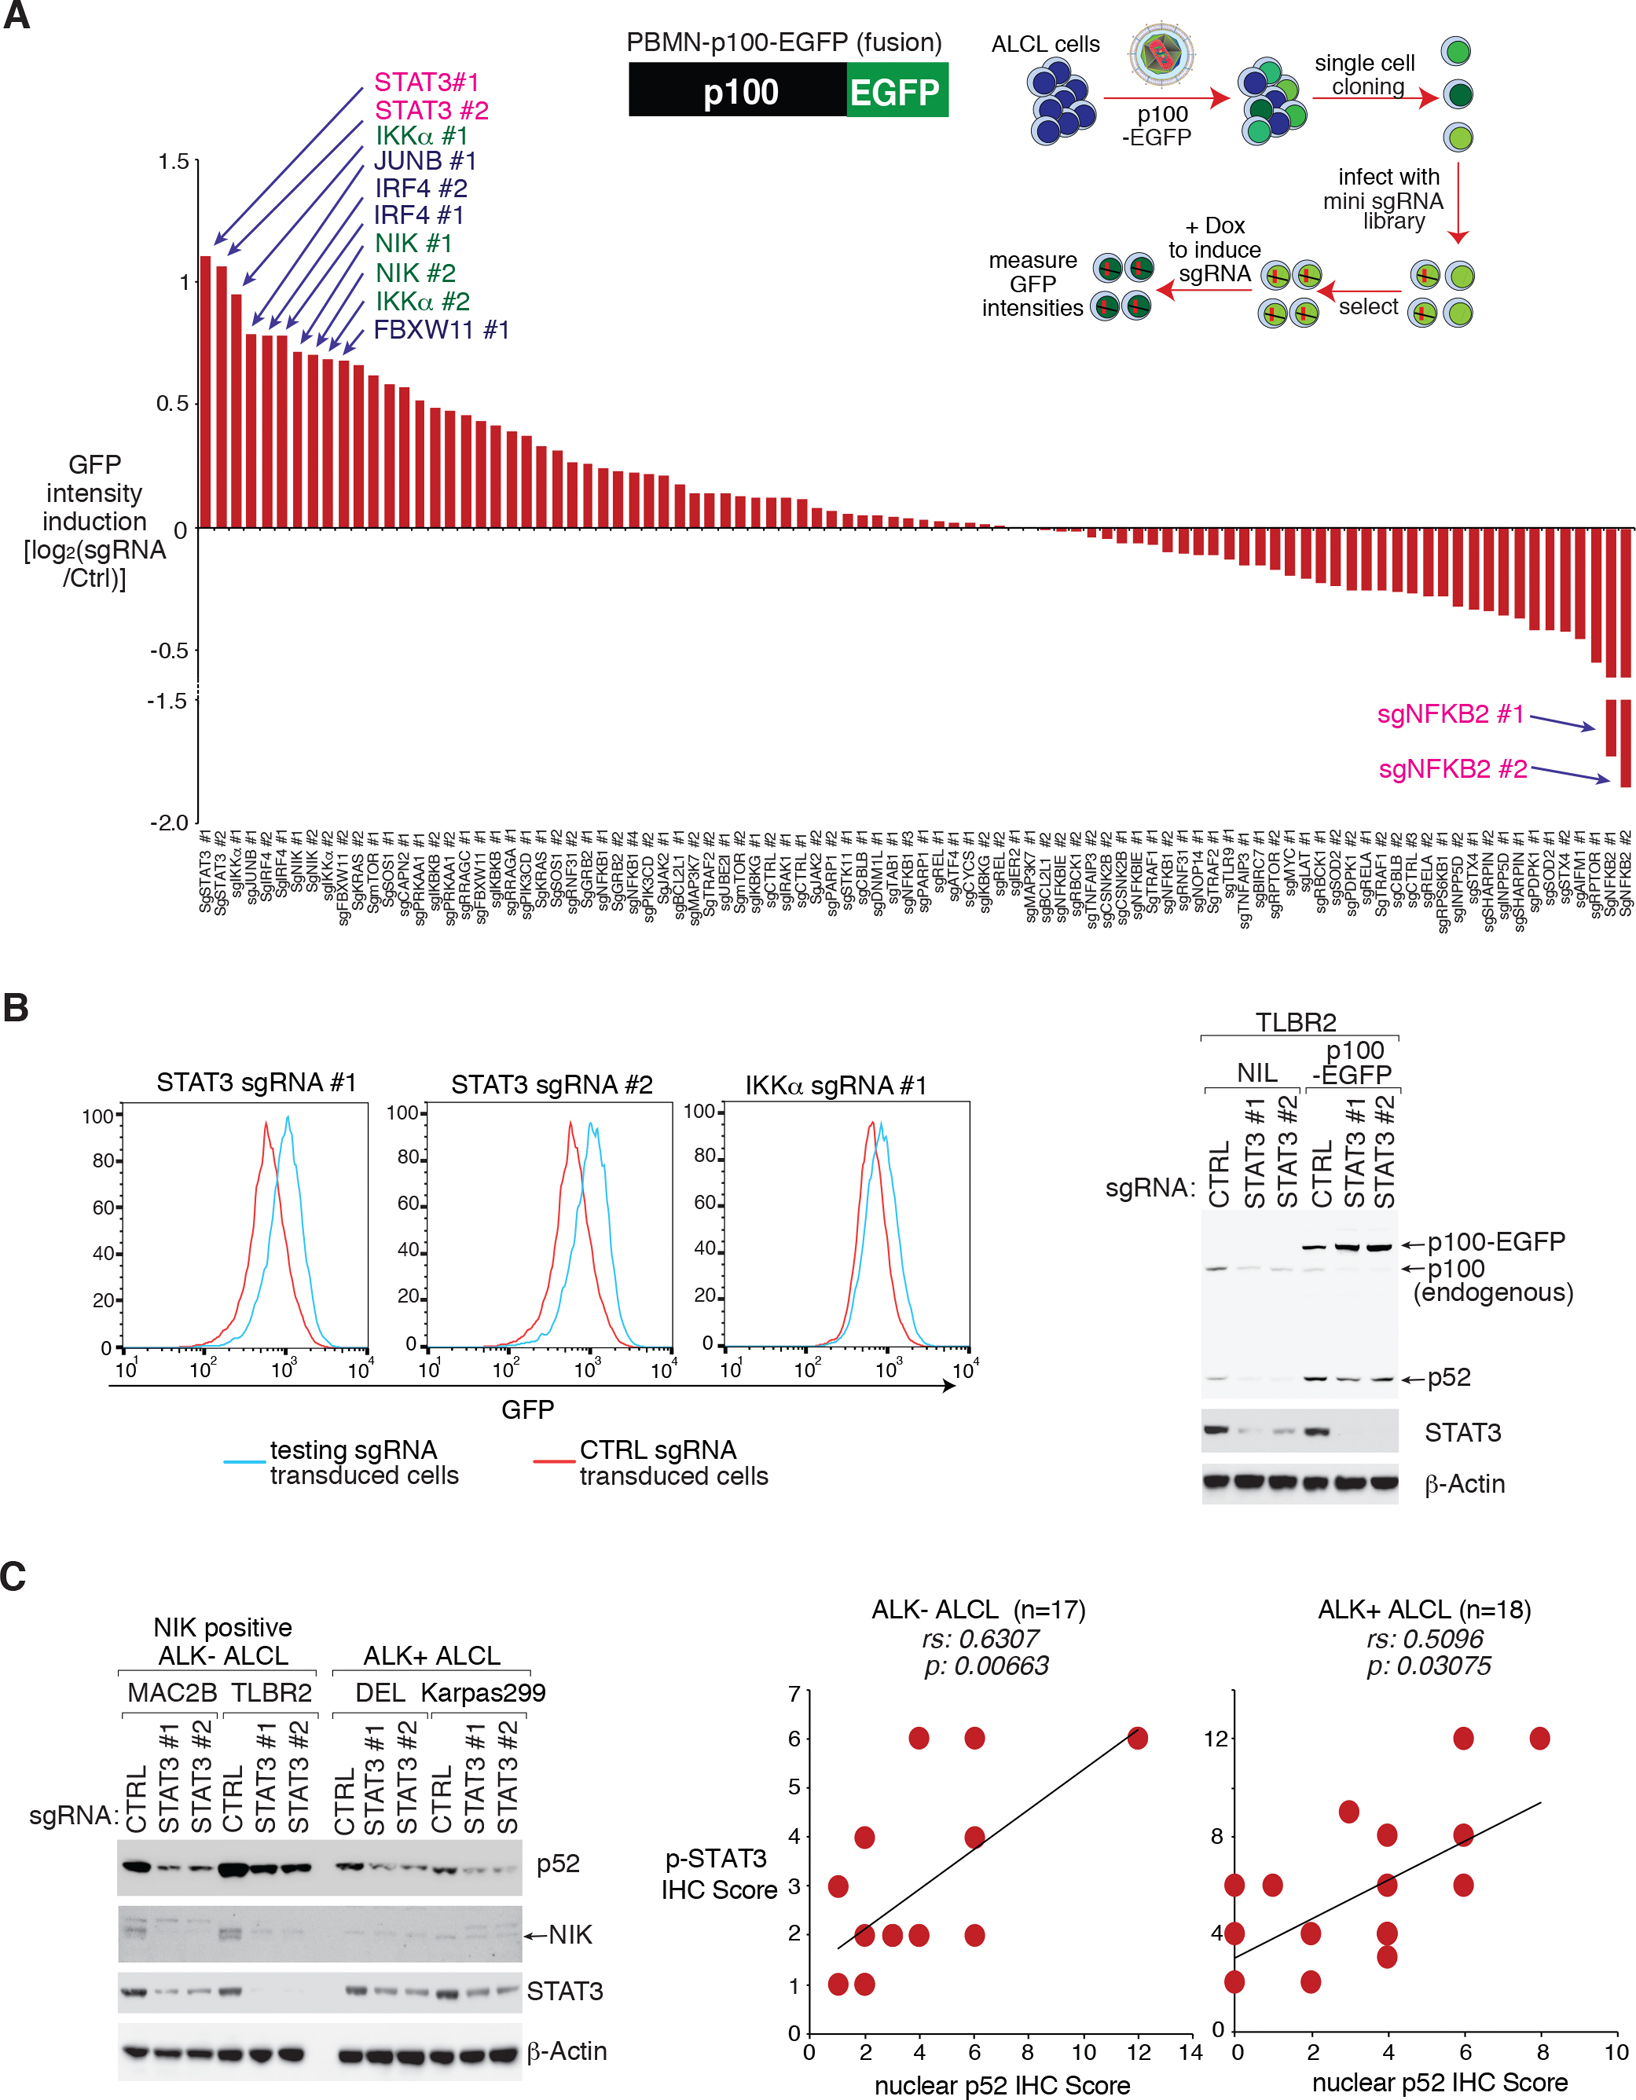
Figure 3: STAT3 supports the alternative NF-κB pathway in ALCL.

A. Mini CRISPR library screen using the p100-EGFP reporter. The TLBR2 p100-EGFP reporter line was transduced with each individual sgRNAs in the mini CRISPR library, and induced to express for 4 days. The relative GFP intensity in each sgRNA transduced sample was measured by FACS and normalized to Ctrl sgRNA transduced samples. The log2 fold changes of GFP intensity in each sgRNA transduced sample vs Ctrl sgRNA were calculated and plotted. B. Confirmational EXP for (A). left: The TLBR2 p100-EGFP reporter line was transduced with indicated sgRNAs, the relative GFP intensity in each sgRNA transduced sample was measured by FACS. right: The TLBR2 p100-EGFP reporter line or the parental controls were transduced with indicated sgRNAs, selected and expression induced. Lysates were analyzed by immunoblotting for the indicated proteins. C. left: Indicated ALCL lines were transduced with STAT3 or Ctrl sgRNAs, selected and expression induced. Lysates were analyzed by immunoblotting for the indicated proteins. right: Correlation between p-STAT3 IHC scores with nuclear p52 IHC scores, was calculated by Spearman’s rank correlation methods, in 17 ALK− ALCL cases and in 18 ALK+ ALCL cases.
