
Figure 1:
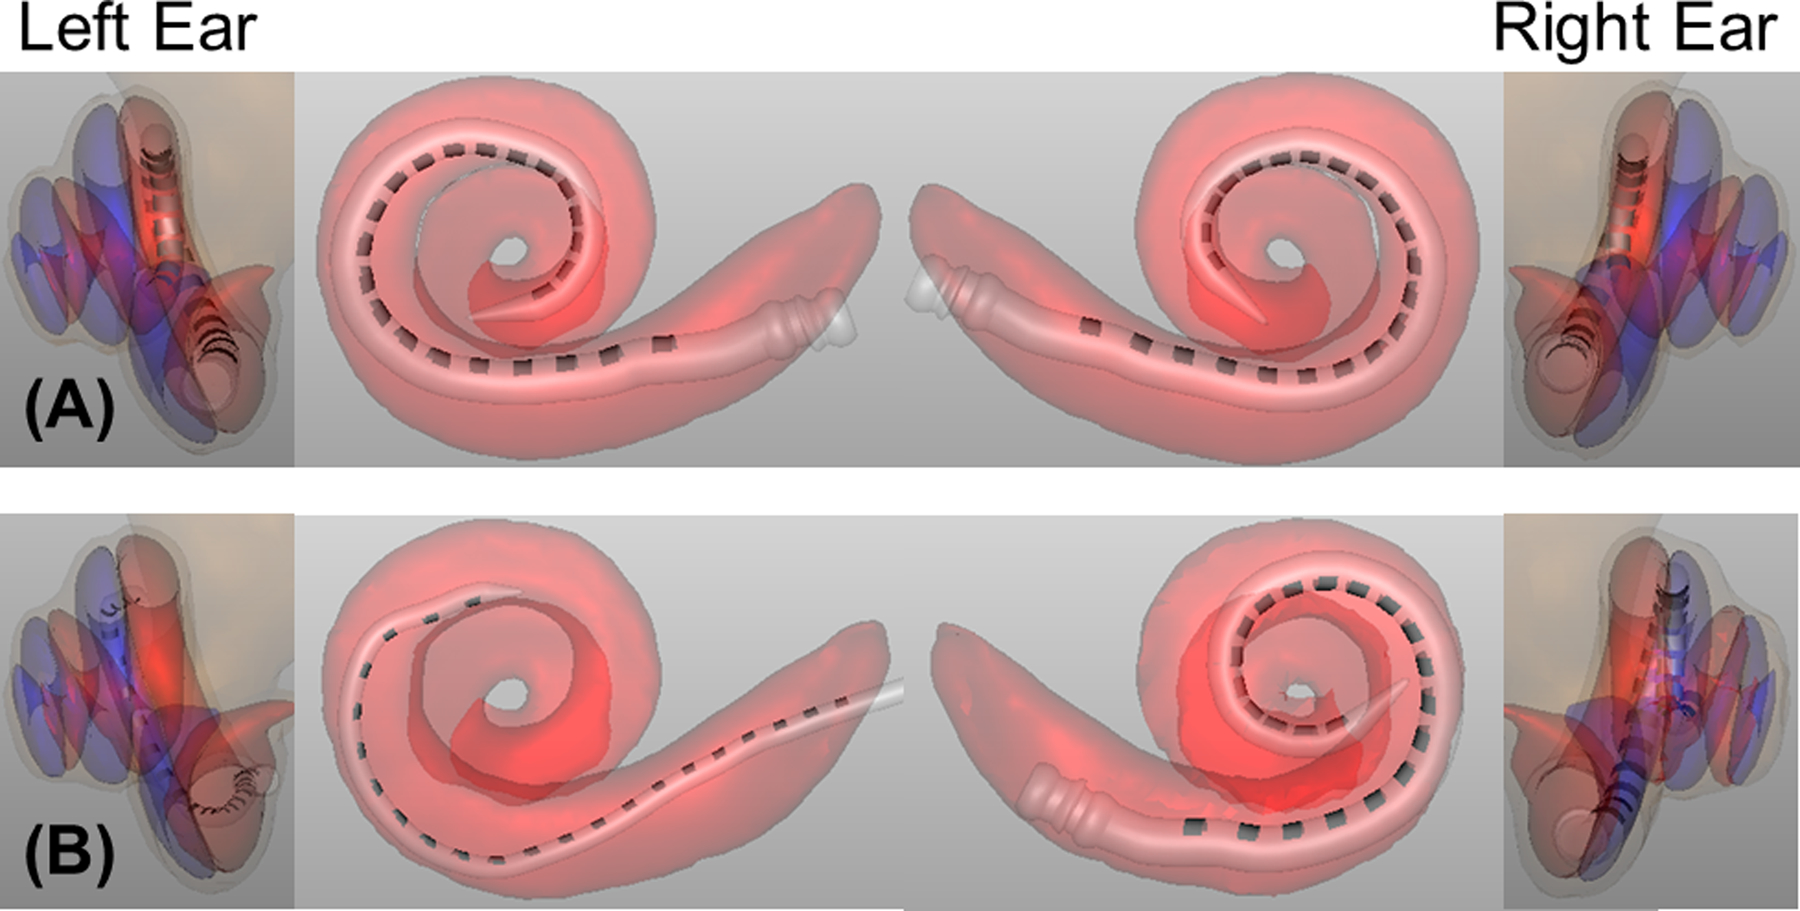
CT-scan model analyses for two example BI-CI users, with the left two columns showing the left ear and the right two columns showing the right ear. Insertion depth can be seen in the center panels. Scala location can be seen in the leftmost and rightmost panels; ST is shown in red and SV is shown in blue. The example BI-CI user in the top row (A) has a relatively small amount of interaural insertion-depth mismatch (center panels). The electrode arrays are both located in ST (red regions, leftmost and rightmost panels), and thus there is no interaural scalar mismatch. The example BI-CI user in the bottom row (B) has a relatively large amount of insertion-depth mismatch (the right-ear array is much deeper than the left-ear array) and there are numerous electrodes located in the blue regions outside of ST (i.e., some electrode pairs have an interaural scalar mismatch).