
Figure 2:
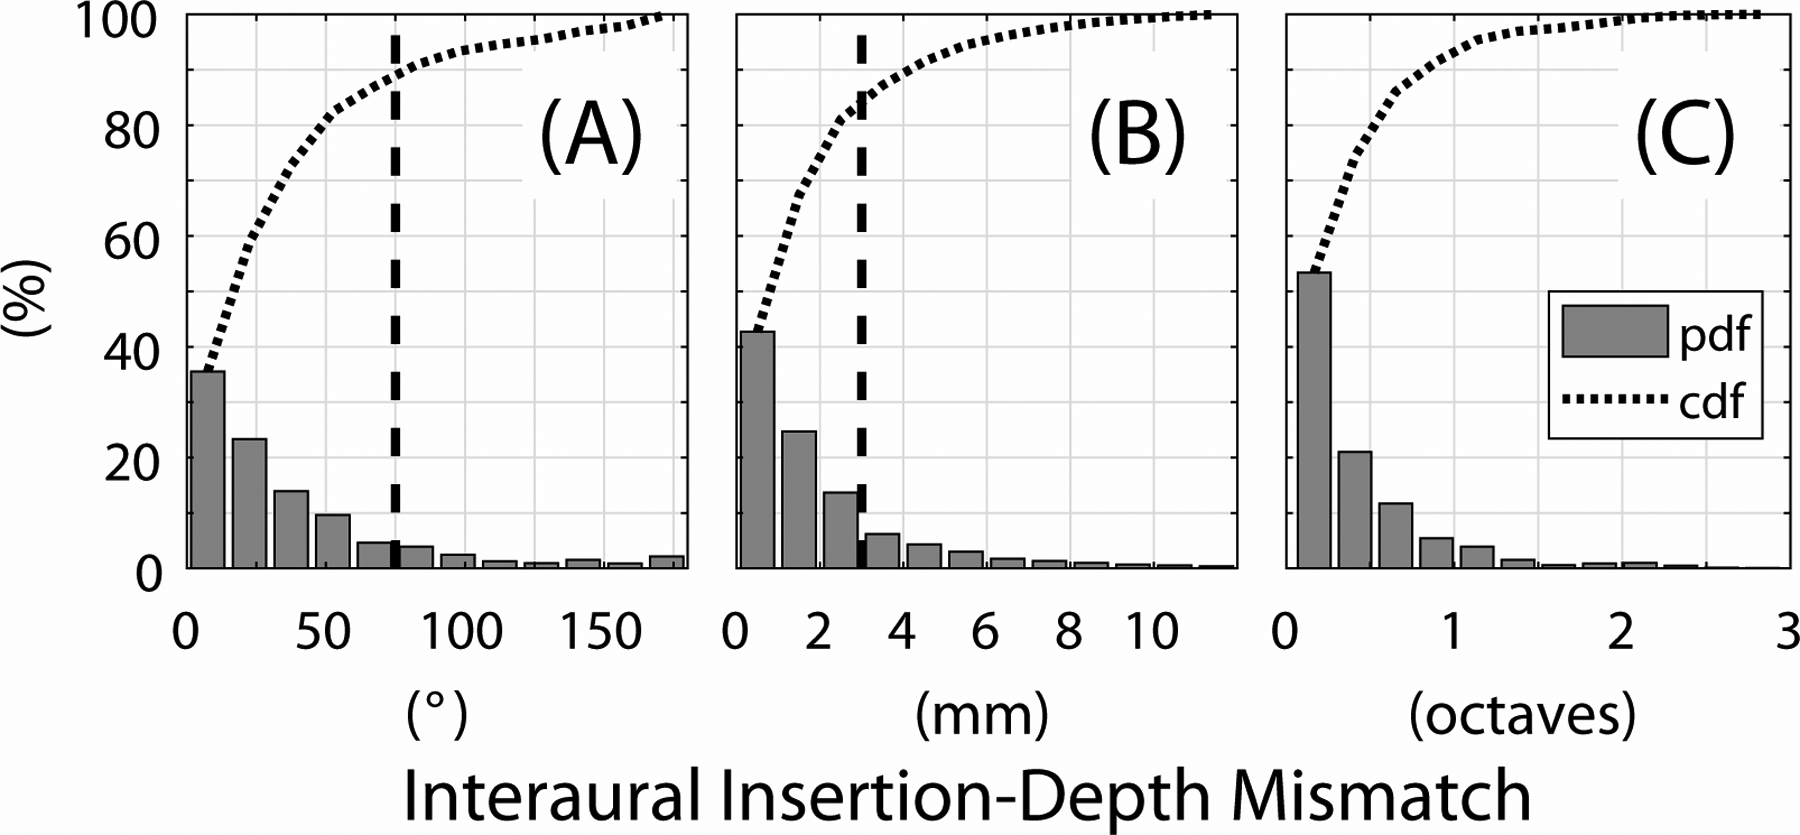
Distributions of interaural insertion-depth mismatch evaluated with respect to angle (degrees; panel A), distance (millimeters; panel B), and center frequency (octaves; panel C). Bars represent the probability distribution function (pdf) and the dotted curve shows the cumulative distribution function (cdf; i.e., the cumulative summation of the pdf). The vertical dashed lines depict an interaural insertion-depth mismatch of 75° (panel A) and 3 mm (panel B), respectively. These represent the lower boundary of the clinically relevant range where interaural insertion-depth mismatch is expected to degrade binaural perception.